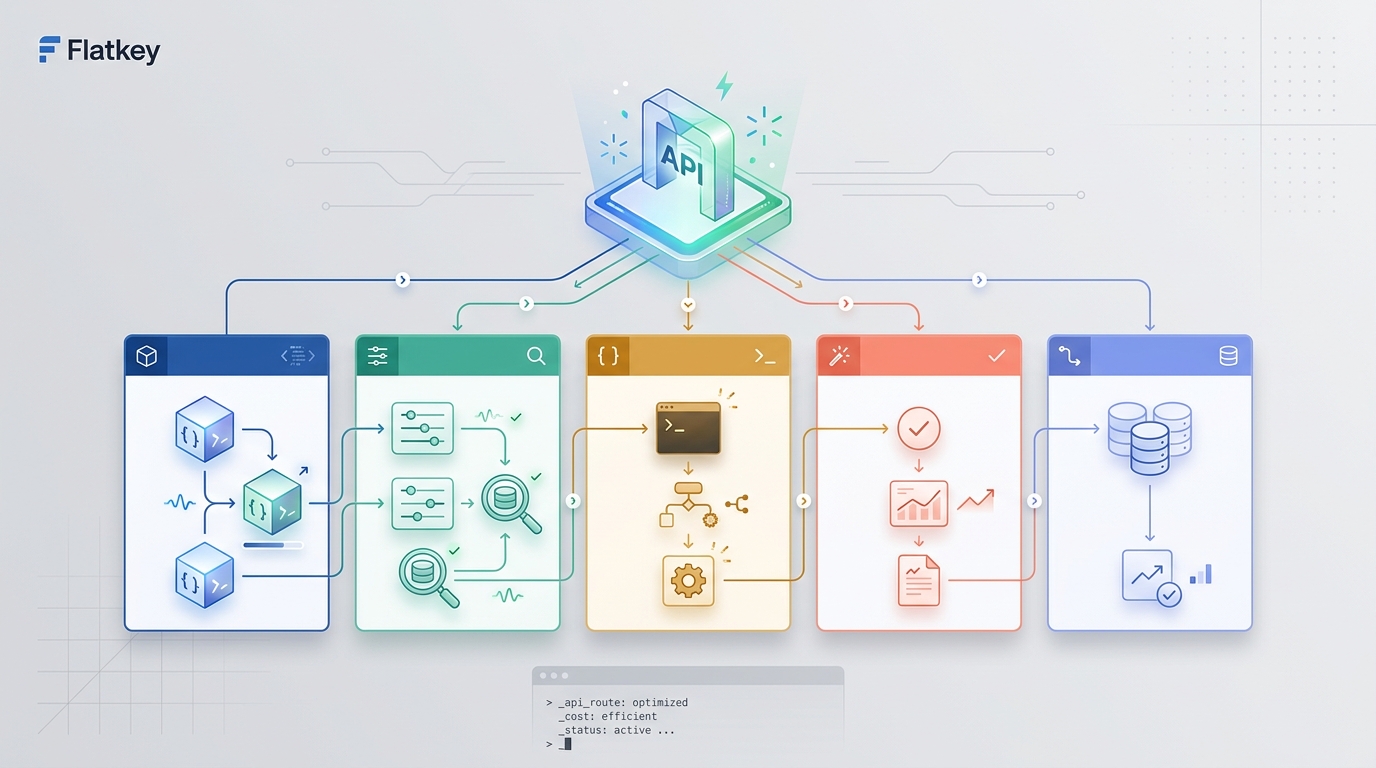
An AI gateway KPI dashboard should do more than count requests. After you publish an AI feature, migrate SDK traffic, or promote a unified model gateway, the dashboard has to show whether people can find the feature, whether they can reach a working model, whether the route is reliable, whether spend is explainable, and whether revenue signals justify the next rollout.
That is why an AI gateway KPI dashboard needs three operating views at the same time: SEO demand, product behavior, and revenue health. Search Console can show impressions, clicks, CTR, and average position for the pages and queries that introduce the gateway. Product analytics and GA4 key events can show whether those visitors click pricing, sign up, create a key, or run a first request. Gateway telemetry can show model usage, token or media units, request status, latency, errors, fallback behavior, and cost. Finance can then connect usage to credits, invoices, overages, gross margin, and renewal evidence.
Flatkey matters in this workflow because the live flatkey.ai site positions the product as one key for multiple AI models, an OpenAI-compatible base URL, and a dashboard for usage, cost, routing, and errors. Treat that as the gateway control surface. Do not treat it as a replacement for your own KPI contract. Before you make executive or customer-facing claims, verify the exact account fields, export options, retention behavior, pricing version, and route configuration in your current Flatkey workspace.
AI Gateway KPI Dashboard: The Short Version
The useful dashboard is not a wall of charts. It is a chain of evidence from demand to revenue.
| Layer | Question | Core KPIs | Evidence source | Owner |
|---|---|---|---|---|
| Search demand | Are the right buyers finding the gateway story? | Impressions, clicks, CTR, average position, query/page movement | Google Search Console Performance reports | SEO |
| Content path | Do readers move from guide to product proof? | Internal-link clicks, pricing clicks, sign-up clicks, docs clicks | GA4 or product analytics | Growth |
| Product activation | Can a visitor become a working user? | Sign-up rate, key creation, first successful request, time to first 200 | Product events and gateway logs | Product |
| Gateway reliability | Is AI traffic usable after launch? | Success rate, 4xx/5xx rate, latency, timeout rate, fallback rate | Gateway telemetry and app logs | Platform |
| Cost control | Can spend be explained? | Tokens, media units, request count, cost by route, cost per successful request | Gateway, provider, and billing exports | Finance ops |
| Revenue | Is usage converting into money or retention? | Credit top-up, paid conversion, expansion, overage, gross margin | Billing, CRM, and warehouse | Revenue ops |
| Evidence freshness | Can the team trust the numbers? | Last sync, owner, source status, threshold, action queue | Dashboard metadata | RevOps or platform |
If the AI gateway KPI dashboard cannot connect those layers, it will create arguments instead of decisions. SEO will see traffic without adoption proof. Product will see activations without margin proof. Finance will see spend without request-level context. Engineering will see errors without business priority.
Why Request Counts Are Not Enough
Most gateway dashboards start with operational metrics: request volume, status code, latency, and model spend. Those metrics are necessary, but they are not sufficient after publishing. A route can be technically healthy while acquisition is weak. A blog or docs page can grow impressions while sign-up quality is poor. A model can look cheap per token while retries, fallbacks, and long prompts destroy margin.
The missing piece is the join key between go-to-market, product, and platform systems. Decide those joins before launch:
| Join | Example | Why it matters |
|---|---|---|
| Content page to CTA | /blog/ai-api-gateway to pricing or sign-up click |
Shows whether education creates intent |
| CTA to account | Sign-up session to workspace ID | Connects acquisition to product activation |
| Account to key | Workspace ID to API key or project | Separates trial traffic from production traffic |
| Key to route | API key to model alias, provider, or route group | Explains routing behavior and spend |
| Route to revenue | Workspace, customer, plan, credit top-up, invoice, or overage | Connects traffic to commercial outcome |
| Metric to owner | KPI threshold to a named owner and action | Prevents dashboards from becoming passive reports |
An AI gateway KPI dashboard should make those joins visible. If the join breaks, the dashboard should show that the metric is not decision-grade yet.
Start With The Publishing Moment
"After publishing" means the moment a gateway-backed feature, article, integration guide, pricing update, or migration path becomes public. The first dashboard window should answer five practical questions.
- Did the market see it?
- Did the right visitors click deeper?
- Did a user create or use a key?
- Did the gateway handle the traffic reliably?
- Did usage create a revenue or cost signal worth acting on?
That sequence keeps the AI gateway KPI dashboard from over-optimizing one team metric. A content launch with rising impressions but no pricing clicks is an SEO problem. Pricing clicks with no key creation is a product or offer problem. Key creation with failed first requests is a platform problem. Healthy requests with negative margin is a finance problem. Positive activation with weak retention is a customer-success problem.
The Data Contract For Each KPI
Every KPI on the dashboard should have a contract. Without it, the team will debate definitions every time the number moves.
| Field | Example | Rule |
|---|---|---|
metric_name |
first_successful_gateway_request_rate |
Use stable names that survive dashboard redesigns |
business_question |
"Can new users reach a working model?" | Tie every metric to a decision |
source_system |
GSC, GA4, Flatkey, app logs, billing, CRM | One primary source, with fallbacks documented |
join_key |
workspace_id, api_key_id, landing_page, campaign_id |
Make the route from demand to revenue traceable |
freshness_sla |
24 hours for product, 3 days for GSC | Keep lag explicit |
threshold |
>= 85% first request success |
Define the action point before launch |
owner |
Platform engineering | One team owns the metric |
action |
Open incident, update guide, change route, review pricing | A KPI without an action is decoration |
proof_link |
Dashboard, query, log export, invoice, test run | Store evidence for review |
Use this contract for SEO metrics too. Search Console documentation frames the Performance report around search result performance metrics such as clicks, impressions, CTR, and average position. Those numbers are powerful, but they lag and they do not prove product activation by themselves. The AI gateway KPI dashboard should show them as acquisition evidence, then hand off to product events and gateway telemetry.
SEO Signals: Measure Discovery And Intent
For gateway content, SEO KPIs should not stop at traffic. They should show whether the right technical reader moved toward proof.
Track these rows:
| KPI | Segment | Action trigger |
|---|---|---|
| Query impressions | Primary and cluster terms such as "AI gateway KPI dashboard" | Expand internal links when impressions rise but clicks lag |
| Query clicks | Primary, comparison, migration, reliability, pricing terms | Strengthen title/meta or intro if CTR underperforms |
| Average position | Page and query level | Add internal links or refresh proof when the page stalls outside top 20 |
| Internal-link clicks | Architecture, load balancing, pricing, sign-up links | Improve anchor placement if readers do not advance |
| Pricing or sign-up CTA clicks | Source page and query group | Inspect offer fit when traffic grows without activation |
| Assisted account creation | Landing page to workspace | Prove whether search demand reaches product |
For this article cluster, Ahrefs returned no measurable US exact-query volume, KD, CPC, traffic potential, related terms, or top 10 SERP rows for "AI gateway KPI dashboard" and its close variants. That does not make the topic useless. It means the page should be measured as strategic support content: internal-link contribution, topic coverage, rank movement for cluster terms, and conversion-assisted behavior matter more than demand-size claims.
Product Signals: Measure The First Useful Request
The product layer should answer whether the promise in the page became a working AI call.
Minimum events:
| Product event | Recommended properties | Why it belongs on the dashboard |
|---|---|---|
pricing_viewed |
landing page, query group, plan, locale | Shows commercial intent |
signup_started |
source page, CTA, campaign, locale | Shows offer pull |
workspace_created |
source page, role, company segment | Separates interest from account creation |
api_key_created |
workspace, environment, source route | Shows readiness to integrate |
first_request_sent |
SDK, base URL, model alias, route | Shows implementation start |
first_request_succeeded |
status, latency, model served, token/media units | Shows actual activation |
usage_dashboard_viewed |
workspace, timeframe, filters | Shows whether the user reviews usage evidence |
The most useful product KPI is not raw sign-ups. It is time from visitor to first successful request. If that path is slow, inspect docs, base URL setup, key creation, model naming, quota, and first-run error messages. Link the dashboard to the supporting migration guides, such as the AI API gateway overview, the LLM API gateway architecture guide, and the load balancing/failover guide.
Gateway Signals: Measure Route Health
Gateway telemetry is the technical spine of the AI gateway KPI dashboard. Vercel's AI Gateway observability documentation, for example, describes gateway reporting around spend, model usage, request logs, latency, status, and debugging. Cloudflare's AI Gateway logging documentation describes request logs that can include prompts, responses, tokens, costs, and DLP actions. Use those official examples as common gateway-observability patterns, not as Flatkey-specific field promises.
Track gateway health at the route level:
| KPI | Formula | Notes |
|---|---|---|
| Successful request rate | 2xx_gateway_requests / total_gateway_requests |
Segment by route, model alias, workspace, and environment |
| First request success | first_successful_requests / first_request_sent |
Product activation metric with platform owner |
| Error mix | 4xx, 429, 5xx, timeout, provider error | Separates integration mistakes from upstream failures |
| P95 latency | P95 gateway duration and app duration | Keep gateway and app timing separate |
| Fallback rate | fallback attempts per logical request | High fallback can hide reliability or cost problems |
| Retry amplification | provider attempts per user action | Explains why spend rises faster than users |
| Cost per successful request | route cost divided by successful requests | More useful than cost per raw request |
| Token/media unit mix | input, output, cached, audio, image, video, seconds | Preserves pricing-unit evidence |
OpenAI's organization usage and costs API examples show completions usage grouped by project, user, API key, model, batch, and service tier, with fields such as input tokens, output tokens, cached tokens, audio tokens, request count, and model. The costs API supports grouping costs by project, line item, and API key. If you use OpenAI directly or through a gateway, preserve enough metadata to reconcile gateway activity against provider-level usage and cost reports.
Revenue Signals: Connect Usage To Commercial Outcome
Revenue KPIs should show whether gateway usage creates money, margin, or renewal evidence.
| Revenue KPI | Source | Decision |
|---|---|---|
| Trial to paid conversion | Product analytics and billing | Improve onboarding or offer when activation is healthy but paid conversion lags |
| Credit top-up rate | Billing system | Shows whether users trust the gateway enough to keep running traffic |
| Revenue per active workspace | Billing plus product activity | Identifies accounts with real production usage |
| Gross margin by route | Gateway cost plus billed revenue | Finds routes that need model policy or pricing review |
| Overage or quota events | Billing, quota service, gateway logs | Shows when customers need plan guidance |
| Failed payment or exhausted balance after usage | Billing and gateway stop reason | Prevents silent product failure |
| Renewal evidence packet completion | CRM plus dashboard exports | Gives sales proof for technical buyers |
If you run usage-based billing, the billing handoff needs its own controls. Stripe's meter event API, for example, uses an event name and payload; examples include fields for value and customer mapping, with an identifier for uniqueness. That pattern is a reminder to make AI usage billing idempotent. A retry should not double bill. A fallback should follow a clear billing policy. A customer dispute should trace back to request IDs, usage units, pricing version, and meter-event evidence.
The Dashboard Layout That Works
Use four dashboard zones.
| Zone | What it shows | Who uses it |
|---|---|---|
| Executive strip | Search demand, activation, reliability, spend, revenue, freshness | Leadership |
| Funnel view | Page to pricing to sign-up to key to first 200 | SEO, growth, product |
| Route health view | Requests, errors, latency, fallback, retries, model mix, cost | Platform engineering |
| Evidence queue | Broken joins, stale data, threshold breaches, missing exports, owner actions | RevOps and platform |
The evidence queue is what makes an AI gateway KPI dashboard operational. A beautiful chart that says "cost up 31%" is less useful than a queue item that says "production route chat-support crossed the cost-per-success threshold because fallback attempts rose after the last model alias change; platform owner assigned; pricing review not required until fallback policy is confirmed."
Acceptance Tests Before You Trust The Dashboard
Do not publish the dashboard to executives until these tests pass.
| Test | Pass condition |
|---|---|
| Source freshness | Every tile shows last sync time and primary source |
| CTA trace | A test visitor can move from content page to pricing or sign-up and appear in analytics |
| Key trace | A test workspace can create a key and appear in product events |
| Request trace | A test request can be joined from app event to gateway log |
| Cost trace | A test route can be joined to provider or gateway cost evidence |
| Revenue trace | A test paid action, top-up, or billing event can be joined to account and source |
| Error trace | A forced 401, 429, timeout, or provider failure lands in the right bucket |
| Owner trace | Every threshold breach creates a named owner or ticket |
| Privacy review | The dashboard avoids raw prompts, secrets, and personal data unless explicitly approved |
Run those tests again after any SDK migration, route change, model alias change, pricing change, or analytics property change. The dashboard is part of the gateway architecture, not a reporting afterthought.
A 30-60-90 Day Operating Cadence
During the first 30 days, keep the AI gateway KPI dashboard focused on proof of life: indexing, impressions, pricing clicks, sign-ups, key creation, first successful request, top errors, cost per successful request, and balance or credit events. Expect Search Console data to lag; do not overreact to the first few days of SEO movement.
From day 31 to day 60, add segmentation: query cluster, page, locale, workspace segment, route, model alias, environment, and billing status. This is when you can identify whether one route, one content path, or one customer segment is carrying the launch.
From day 61 to day 90, convert the dashboard into planning evidence. Refresh pages that get impressions without clicks. Add internal links to pages that assist activation. Retire routes that create bad margin. Expand model policies that improve reliability. Give sales a renewal packet for accounts with stable usage and clean cost evidence.
How Flatkey Fits
Flatkey's public positioning is useful for teams that want one gateway surface instead of separate provider accounts: one API key, an OpenAI-compatible route, pricing visibility, and a dashboard for usage, cost, routing, and errors. That makes it a practical surface for the gateway side of the AI gateway KPI dashboard.
Keep the boundary clear:
- Use Flatkey as the access, routing, usage, and cost review surface when your account confirms the relevant fields.
- Keep your own application events for source page, CTA, workspace, customer, feature, and revenue attribution.
- Keep billing-system evidence for paid conversion, credit top-up, invoice, or usage-meter events.
- Keep provider/tool docs as pattern evidence only unless the same field is verified in your Flatkey account.
- Keep pricing and model claims dated, because model catalogs and costs can change.
That boundary lets platform, product, SEO, and finance share one operating view without turning the dashboard into unsupported product claims.
Implementation Checklist
Before you call the AI gateway KPI dashboard complete, confirm that:
- Primary SEO pages are mapped to query clusters and CTA paths.
- Pricing and sign-up clicks are tagged with page, query group, locale, and campaign context.
- Workspace, key, and first request events share a stable account join key.
- Gateway logs can be joined to route, model alias, status, latency, usage units, and cost.
- Retries and fallbacks are attached to a logical parent request.
- Cost is reported per successful request, not only per raw request.
- Billing events use idempotent identifiers.
- Nonproduction traffic is excluded or separately marked.
- Every KPI has a threshold, owner, source, freshness window, and action.
- The dashboard has an evidence queue for broken joins, stale data, and threshold breaches.
FAQ
What is an AI gateway KPI dashboard?
An AI gateway KPI dashboard is an operating dashboard that connects acquisition, product activation, route health, model usage, cost, revenue, and evidence freshness for AI traffic running through a gateway. It helps teams decide what to fix after a gateway launch.
Which KPIs should the first version include?
Start with impressions, clicks, CTR, pricing clicks, sign-ups, key creation, first successful request, success rate, error mix, P95 latency, fallback rate, cost per successful request, credit top-up, paid conversion, and dashboard freshness.
Should SEO metrics and gateway metrics be in the same dashboard?
Yes, if the launch depends on organic discovery or content-led education. SEO metrics show whether the market is finding the gateway story. Gateway metrics show whether the product promise works after the visitor becomes a user.
How often should the dashboard refresh?
Product, gateway, and billing metrics should usually refresh daily or faster. Search Console data can lag, so show the data date separately from the dashboard refresh date. Never mix stale acquisition data with real-time route data without labeling freshness.
What should Flatkey users verify before relying on the dashboard?
Verify the current Flatkey account fields for usage, cost, routing, errors, exports, pricing units, model availability, and retention. Then join those fields to your own application analytics and billing evidence before using the dashboard for pricing, margin, or customer-facing claims.
The CTA for this workflow is simple: get the gateway under one key, then make every metric decision-grade. If you want to test the route and build the first evidence chain, start with Flatkey and get a key.