AI Routing API Metrics That Actually Matter
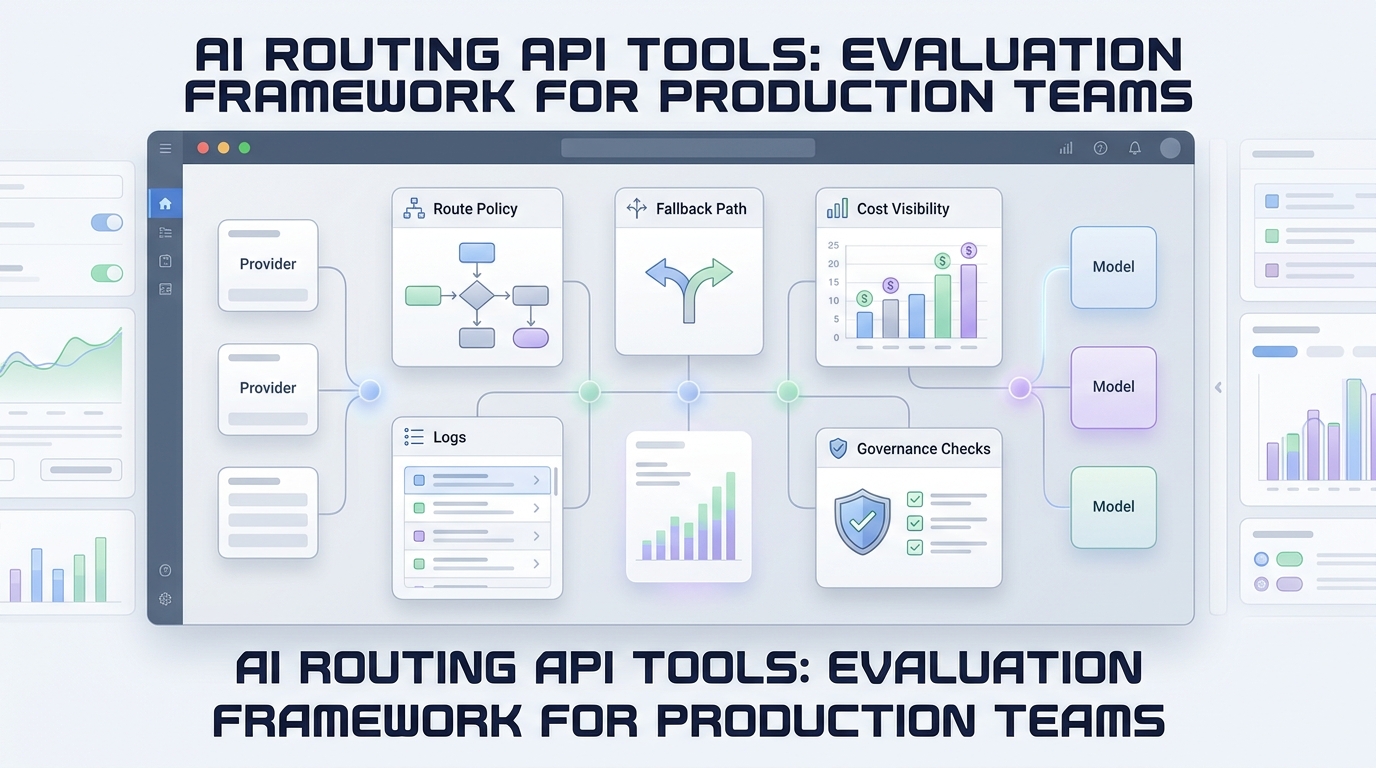
An AI routing API should make production AI calls easier to operate, not just easier to send. If the only dashboard you check is total tokens by model, you can miss the problems routing was supposed to solve: failed requests, slow first tokens, noisy fallbacks, hidden retry cost, and incidents that are hard to explain after the fact.
The useful question is simple: after traffic moves through an AI routing API, can your team prove that reliability, latency, cost control, and debugging improved?
This guide gives you a practical scorecard. Use it when you are evaluating AI routing API tools, reviewing an existing LLM gateway, or deciding whether direct provider accounts are still enough.
The quick answer: measure outcomes, not routing activity
Routing activity is easy to count. A gateway can show request volume, model names, provider names, and spend totals. Those are necessary, but they do not prove the AI routing API is doing useful work.
The metrics that matter are:
| Metric group | What it answers | Healthy signal |
|---|---|---|
| Request outcome quality | Did the user get a usable answer? | More successful, accepted, and non-retried responses by workload |
| Fallback effectiveness | Did fallback recover real failures? | Fallbacks recover incidents without creating bad outputs or runaway cost |
| Latency and throughput | Did routing improve user experience? | Lower p90/p99 latency for interactive paths and predictable throughput for batch paths |
| Cost per accepted output | Did the routed answer cost less in practice? | Lower cost after retries, fallbacks, failed calls, and rejected outputs are included |
| Observability and auditability | Can the team explain what happened? | Every request can be tied to key, route, model, provider, policy, cost, and error class |
That is the difference between a model picker and an operating layer. A model picker chooses where a call goes. A production AI routing API also helps you understand whether that choice worked.
Metric 1: request outcome quality
Start with request outcomes because they are closest to user value. A cheaper or faster route is not useful if the response fails validation, breaks a schema, refuses when it should not, or forces the user to regenerate.
Track outcomes at the workload level, not only at the model level. A support summarizer, code review agent, product image workflow, and batch enrichment job should each have their own baseline.
Use these fields for every routed call:
| Field | Why it matters |
|---|---|
workload |
Separates interactive product paths from internal jobs |
route_policy |
Shows whether the call used latency, cost, quality, region, or fallback rules |
requested_model |
Captures what the application asked for |
final_model |
Captures what actually generated the response |
status |
Separates success, provider error, timeout, rate limit, validation failure, and policy block |
accepted_output |
Tells whether the result passed your application’s own quality gate |
retry_count |
Shows hidden work behind one apparent request |
fallback_count |
Shows whether routing changed provider or model path |
The most useful single metric is accepted response rate:
accepted_response_rate =
  accepted_outputs / user_or_job_requests
Do not use raw HTTP success as a substitute. A 200 response can still be unusable if the output violates JSON schema, misses a tool call, produces the wrong modality, or arrives too late for the product interaction.
For an AI routing API, this metric should be reviewed by workload and route policy. If accepted response rate falls after a new routing rule, the rule is harming the product even if model spend looks better.
Metric 2: fallback effectiveness
Fallback is one of the main reasons teams adopt an AI routing API, but fallback can be misleading. A fallback event is not automatically good. It is good only when it recovers a user-visible failure without making the result worse or too expensive.
Track these fallback metrics:
| Metric | Formula or definition | What to watch |
|---|---|---|
| Fallback trigger rate | Requests with at least one fallback / total requests | Spikes indicate provider instability, bad limits, or overly aggressive timeouts |
| Fallback recovery rate | Accepted outputs after fallback / fallback-triggered requests | Low recovery means the fallback path is decorative |
| Fallback penalty | Latency and cost delta between primary-only success and fallback success | High penalty may justify a different primary route |
| Fallback mismatch rate | Fallback outputs rejected for schema, tool, modality, or policy mismatch | Shows whether backup models are truly compatible |
| Final-route visibility | Share of requests where final model/provider are logged | Required for debugging and cost review |
The fallback recovery rate is the one executives will understand:
fallback_recovery_rate =
  accepted_outputs_after_fallback / requests_that_triggered_fallback
For developers, the more important metric is fallback mismatch rate. If your primary route supports structured outputs, tool calling, a long context window, or image generation parameters, the fallback must support the same contract. Otherwise the AI routing API may hide provider failure but introduce application failure.
Flatkey’s REST API overview frames its API as OpenAI-compatible at https://router.flatkey.ai/v1, with one base URL for endpoints, providers, and models. That compatibility is useful during migration, but the operating metric still needs to check the final route and output contract for each workload.
Metric 3: latency and throughput by percentile
Average latency hides the pain that users notice. Use p50 to understand the normal path, p90 for most user-facing expectations, and p99 for incident review.
For interactive products, measure:
| Metric | Use it for |
|---|---|
| Time to first token or first chunk | Chat, coding agents, streaming assistants, and any UI where progress matters |
| End-to-end duration | Non-streaming responses, structured outputs, image tasks, and tool calls |
| p90 latency by route policy | User-facing SLO review |
| p99 latency by provider and final model | Incident and tail-risk review |
For batch or agentic workloads, throughput can matter more than first-token speed:
| Metric | Use it for |
|---|---|
| Tokens per second | Long generation jobs, code agents, summarization, extraction |
| Completed jobs per minute | Queue health and worker sizing |
| Retry-adjusted throughput | Real throughput after errors and fallbacks |
OpenTelemetry’s generative AI semantic conventions are useful because they name metrics such as token usage, operation duration, time to first chunk, and time per output chunk. You do not need to copy the whole schema on day one, but you should avoid inventing one-off names that make later observability painful.
For an AI routing API, percentile metrics should always be segmented by:
- workload
- route policy
- requested model
- final model
- final provider or route
- streaming versus non-streaming
- retry and fallback status
That segmentation is what turns a chart into an operational answer. Without it, you can see that latency got worse but not whether the cause was a provider, a model, a routing rule, a retry storm, or a workload change.
Metric 4: cost per accepted output
Token price is only a starting point. It does not include failed attempts, retries, fallback attempts, rejected responses, long-context waste, or the human time spent debugging routing incidents.
For production review, calculate cost per accepted output:
cost_per_accepted_output =
  total_cost_for_workload / accepted_outputs
Then split that cost into:
| Cost component | Why it matters |
|---|---|
| Primary attempt cost | Baseline cost if nothing fails |
| Retry cost | Hidden cost from transient failures and strict timeouts |
| Fallback cost | Cost of recovery paths |
| Rejected-output cost | Spend that did not produce usable product value |
| Tool or media cost | Required for workflows that call paid tools, image APIs, or video APIs |
This is especially important when comparing a direct provider account with an AI routing API. A direct account can look cheaper on list price while still costing more per accepted output if rate limits, downtime, or missing models cause retries and manual work. The reverse can also be true: a router can look convenient but become expensive if every fallback path lands on a premium model.
Flatkey’s model directory is useful here because it exposes model comparison surfaces such as price, context, speed, and live health. The right operating metric is not “did this model have the lowest listed price?” It is “did this route produce accepted output at the lowest reliable cost for this workload?”
Metric 5: observability and auditability
The strongest AI routing API metric is often not a chart. It is whether an engineer can answer an incident question in five minutes.
For every production request, log enough context to reconstruct the route:
| Audit field | Required answer |
|---|---|
request_id |
Which exact request are we discussing? |
api_key_id or environment |
Which team, app, or environment sent it? |
workload |
Which product path or job sent it? |
route_policy |
What rule was supposed to apply? |
requested_model |
What did the app ask for? |
final_model |
What answered? |
final_provider_or_route |
Where did the request actually go? |
status and error_type |
What happened? |
input_tokens and output_tokens |
How much work was done? |
cost |
What did it cost? |
latency_ms and time_to_first_chunk_ms |
How slow was it? |
retry_count and fallback_count |
How much hidden recovery happened? |
Flatkey’s quickstart tells users to check Usage Logs after a first request and expect model, token counts, latency, and cost. That is the right foundation. For production, add ownership, route policy, outcome status, and fallback context so logs can support incident review and finance review.
The AI routing API scorecard
Use this scorecard before buying, after migration, and during monthly review.
| Question | Metric | Pass condition |
|---|---|---|
| Are users getting usable answers? | Accepted response rate | Stable or higher by workload after routing changes |
| Are fallbacks actually recovering failures? | Fallback recovery rate | High enough to justify the added path complexity |
| Are fallbacks compatible? | Fallback mismatch rate | Low enough that fallback does not create app-level failures |
| Is user experience improving? | p90/p99 latency, time to first chunk | Meets workload-specific SLOs |
| Is the system cheaper in practice? | Cost per accepted output | Lower after retries, fallbacks, and rejected outputs are included |
| Can engineers debug incidents? | Request audit completeness | Route, final model, error, latency, tokens, and cost are visible |
| Can finance review usage? | Cost by key, workload, route, and model | Spend maps to owners and product paths |
| Can teams change safely? | Before/after route-policy comparison | New policies can be rolled out and measured separately |
If a vendor cannot expose the fields needed for this scorecard, you may still use the product, but you should not treat it as your control plane for production AI traffic.
A simple 30-day measurement plan
Do not try to instrument every possible metric at once. Start with a baseline that proves whether the AI routing API is helping.
Week 1: define workloads and request IDs
Pick three to five workloads:
- one interactive chat or assistant path
- one agentic or tool-calling path
- one batch or internal automation path
- one high-cost model path
- one fallback-sensitive path
Add request IDs and workload labels. Without those two fields, later analysis becomes guesswork.
Week 2: add outcome and route fields
For each workload, capture requested model, final model, route policy, status, retry count, fallback count, and accepted output. Keep error types low-cardinality: timeout, rate limit, provider error, validation failure, policy block, and unknown are enough to start.
Week 3: add latency and cost
Capture operation duration, time to first chunk for streaming workloads, input tokens, output tokens, and cost. Segment p90/p99 latency by workload and final route.
Week 4: review routing decisions
Now compare:
- direct provider path versus routed path
- primary-only success versus fallback success
- old route policy versus new route policy
- cost per request versus cost per accepted output
- average latency versus p90/p99 latency
The review should produce route-policy changes, not just a prettier dashboard.
Common mistakes
Mistake 1: treating retries as invisible.
Retries are part of the user experience and the bill. Count them.
Mistake 2: reporting model cost without rejected outputs.
If the application discards a result, that spend did not produce product value.
Mistake 3: using one latency metric for all workloads.
A coding agent, chatbot, image workflow, and nightly enrichment job need different thresholds.
Mistake 4: assuming fallback equals reliability.
Fallback improves reliability only when the backup path is compatible and the recovered output is accepted.
Mistake 5: measuring the router but not the business path.
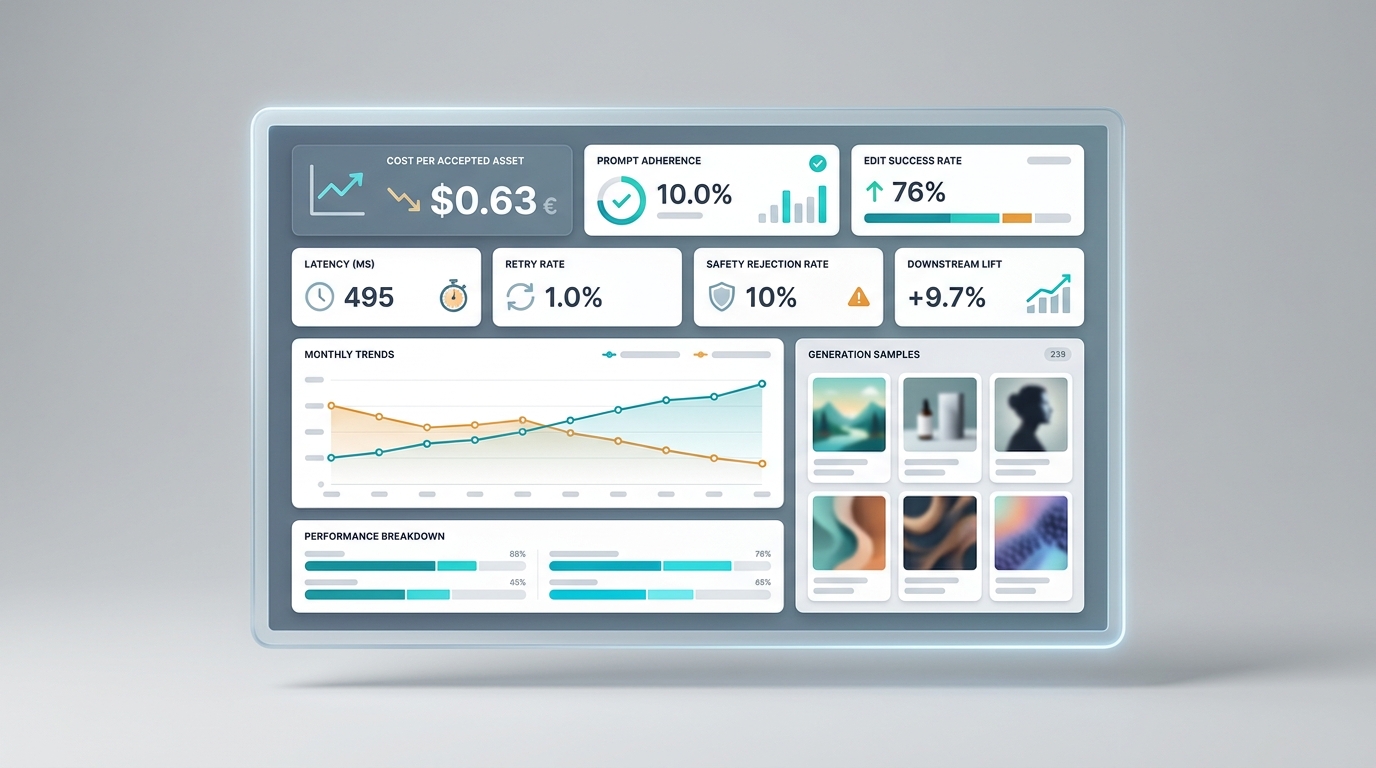
The AI routing API is infrastructure. The real metric is whether the product path became more reliable, faster, cheaper, or easier to debug. The same principle applies to narrower surfaces such as image generation API metrics: measure accepted outputs and operating cost, not just calls sent.
Frequently asked questions
What is the most important AI routing API metric?
For most teams, the most important AI routing API metric is accepted response rate by workload. It connects routing behavior to whether the application received a usable answer.
Is fallback rate a good reliability metric?
Fallback rate is a signal, not a success metric. A higher fallback rate can mean the AI routing API is recovering provider problems, but it can also mean the primary route is unstable or timeout settings are too aggressive. Pair it with fallback recovery rate and fallback mismatch rate.
Should I optimize for cost or latency first?
Optimize by workload. Interactive paths usually need p90 or p99 latency guardrails. Batch paths can often prioritize cost or throughput. The mistake is applying one AI routing API policy to every workload.
How does Flatkey fit into AI routing API measurement?
Flatkey provides an OpenAI-compatible API at https://router.flatkey.ai/v1, a shared model catalog, and usage logs that show model, token counts, latency, and cost. That gives teams a practical base for measuring routed AI calls. Production teams should still define workload labels, accepted-output rules, and route-policy review.
Final takeaway
An AI routing API is worth measuring like production infrastructure. Request count, token totals, and model names are only the surface.
The metrics that actually matter are accepted response rate, fallback recovery, fallback mismatch, p90/p99 latency, cost per accepted output, and audit completeness. Track those by workload and route policy, and your AI routing API becomes easier to evaluate, safer to tune, and easier to defend when product, engineering, and finance ask what changed.
If you are comparing routes now, start with one practical test: send the same workload through your current provider path and through Flatkey’s OpenAI-compatible base URL, then compare accepted output, final model, latency, tokens, cost, and fallback behavior from the same scorecard. If you are still defining the base layer, start with the LLM API basics, then use this scorecard when production traffic starts moving through a router.