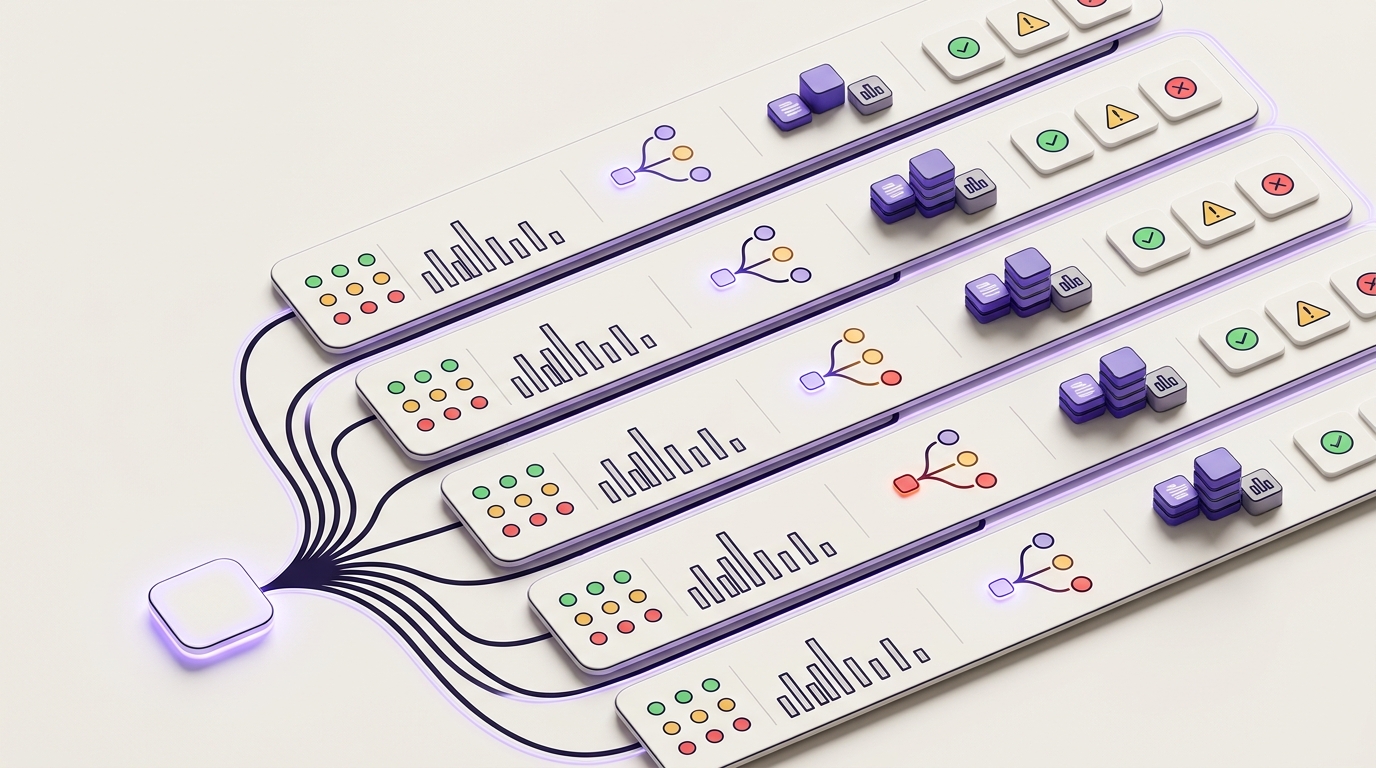
LLM API observability is the practice of turning every model call into enough structured evidence to answer four production questions:
- Did the request succeed?
- How long did the user wait?
- What did the request consume and cost?
- Why did the system choose that model, retry, or fallback?
Ordinary HTTP monitoring is necessary, but it is not sufficient. A 200 OK can still contain invalid JSON, an empty answer, a refused response, a broken tool call, or an output that violates the application contract. A request can also succeed after three attempts and silently cost four times more than expected.
The practical goal is not to log every prompt. It is to create a small, consistent telemetry contract that connects application outcomes with model, provider, route, latency, token usage, retries, and cost—without leaking user data.
This guide shows how to build that contract with metrics, traces, structured logs, service-level objectives, dashboards, and alerts.
What LLM API observability must explain
A useful observability system lets an on-call engineer move from a symptom to a cause quickly.
| Production question | Evidence you need |
|---|---|
| Why did latency spike? | End-to-end duration, provider duration, queue time, time to first token, model, region, retry count |
| Why did cost rise? | Input tokens, output tokens, cached tokens when available, model price snapshot, attempts, accepted-task rate |
| Why are users seeing bad results? | Output validator result, schema errors, refusal state, tool-call result, evaluation score, prompt version |
| Why did traffic move to another model? | Route policy, selected target, fallback reason, circuit-breaker state, provider errors |
| Is the incident provider-specific? | Provider, model, account or deployment, region, status code, provider request ID |
| Can we reproduce one request? | Internal request ID, trace ID, sanitized input fingerprint, prompt version, model parameters |
The first design rule is simple: measure the application contract, not only the transport contract.
The five telemetry layers
LLM API monitoring becomes easier when you separate five layers instead of forcing every signal into one dashboard.
1. Request metrics
Metrics show trends and power alerts. Record counters and histograms for:
- Request count
- End-to-end latency
- Time to first token for streaming responses
- Provider or model-call latency
- Successful, failed, cancelled, and timed-out requests
- HTTP 429 and 5xx responses
- Retry and fallback attempts
- Input, output, and cached tokens
- Estimated and reconciled cost
Metrics should have bounded labels. Good labels include provider, model, route, environment, status, and error_type. Avoid high-cardinality labels such as user IDs, request IDs, prompt text, or full URLs.
2. Distributed traces
A trace explains the path of one request across your API, queue, retrieval layer, tool calls, gateway, and model provider.
A practical trace hierarchy looks like this:
POST /support/reply
├── retrieve_customer_context
├── llm.route
│   ├── llm.attempt provider_a/model_primary
│   └── llm.attempt provider_b/model_fallback
├── validate_structured_output
└── persist_draft
Each model attempt should be its own span. If two providers are tried, the trace must show two attempts rather than hiding both inside one opaque llm.call span.
OpenTelemetry's Generative AI semantic conventions provide a useful shared vocabulary for generative-AI spans, metrics, and events. Treat the convention version as part of your telemetry schema so you can migrate deliberately when attributes evolve.
3. Structured logs
Logs capture discrete decisions and diagnostic context that would be too expensive or too detailed as metric labels.
Useful events include:
llm.request.startedllm.route.selectedllm.retry.scheduledllm.fallback.selectedllm.response.validatedllm.request.completedllm.request.failed
Every event should include the same correlation fields: request_id, trace_id, route, model, provider, prompt_version, and attempt.
4. Quality and contract signals
Quality cannot be inferred from status codes. Add deterministic validators wherever possible:
- JSON parsed successfully
- Required schema fields exist
- Tool name and arguments are allowed
- Citation list is present when required
- Output length is within product limits
- Refusal or safety state is recognized
- Business rule checks pass
For subjective tasks, attach sampled evaluation results later. Keep online request telemetry and offline evaluation joined through a stable request or sample ID.
Before replacing a production model, use a repeatable AI model evaluation workflow rather than relying on aggregate latency and token price alone.
5. Cost and business outcomes
Token counts are usage signals, not business outcomes. Connect model usage to the unit your product cares about:
- Cost per accepted support reply
- Cost per completed coding task
- Cost per generated product image approved by a reviewer
- Cost per qualified lead enriched
- Cost per successful structured extraction
The most useful formula is:
effective cost per accepted task = total model cost / accepted tasks
This exposes false savings. A cheaper model that causes more retries, validation failures, or human rework may increase effective cost.
A minimum telemetry contract for every model call
Start with a versioned event schema. The exact field names can follow your observability stack, but the concepts should remain stable.
{
  "schema_version": "llm-observability.v1",
  "timestamp": "2026-07-30T09:00:00Z",
  "request_id": "req_internal_01",
  "trace_id": "7c4b...",
  "environment": "production",
  "feature": "support_reply",
  "route": "support-default",
  "provider": "provider-a",
  "model": "model-primary",
  "prompt_version": "support-reply-v12",
  "attempt": 1,
  "stream": true,
  "status": "success",
  "http_status": 200,
  "latency_ms": 1840,
  "time_to_first_token_ms": 410,
  "input_tokens": 1640,
  "output_tokens": 284,
  "cached_input_tokens": 900,
  "estimated_cost_usd": 0.0068,
  "validator": "passed",
  "fallback_reason": null,
  "provider_request_id": "redacted-or-scoped-value"
}
Do not make raw prompts and responses required fields. Store them only when there is a defined need, an approved retention policy, appropriate access controls, and a safe redaction path.
Metrics that belong on the first dashboard
Do not start with 40 panels. Build one operational dashboard that answers whether users are receiving valid results within the latency and cost budget.
Traffic and success
- Requests per minute
- Transport success rate
- Validated success rate
- Cancellation rate
- Timeout rate
- Retry amplification ratio
- Fallback rate
Validated success rate should be the primary availability signal:
validated success rate = requests that pass the application contract / eligible requests
This is stricter and more useful than 2xx responses / requests.
Latency
Track distributions rather than averages:
- End-to-end p50, p95, and p99 latency
- Provider-call p50, p95, and p99 latency
- Time to first token p50 and p95
- Queue wait p95
- Tool execution p95
- Validation duration p95
Separate streaming and non-streaming routes. A streaming request can feel responsive with a good time to first token even when total completion time is long.
Reliability
- 429 rate by provider and model
- 5xx rate by provider and model
- Network error rate
- Malformed or schema-invalid response rate
- Tool-call failure rate
- Circuit-breaker open state
- Exhausted retry budget rate
If rate limits are a frequent cause, use a bounded LLM retry strategy for RPM and TPM limits instead of uncoordinated retries in every application worker.
Usage and cost
- Input and output tokens by feature
- Tokens per accepted task
- Estimated cost per request
- Cost per accepted task
- Retry cost
- Fallback cost delta
- Daily spend versus budget
- Cost estimate versus provider invoice or usage export
Keep both estimated_cost and reconciled_cost. The first enables near-real-time monitoring; the second corrects estimates after authoritative billing data arrives.
How to trace retries and fallback routing
Retries and fallbacks are where basic monitoring usually breaks. If all attempts share one status field, an expensive and degraded request can look healthy.
Record these fields for every attempt:
| Field | Why it matters |
|---|---|
attempt |
Shows amplification and the order of decisions |
target_id |
Identifies provider, deployment, region, and model without secrets |
reason |
Distinguishes timeout, 429, 5xx, validation failure, and policy routing |
remaining_budget_ms |
Proves the router respected the user-facing deadline |
safe_to_repeat |
Makes idempotency decisions explicit |
output_started |
Prevents unsafe fallback after streaming output reached the client |
contract_compatible |
Confirms the next target supports the required schema, tools, and modality |
A production LLM API fallback routing playbook should define the decision policy. Observability should then prove that the router followed it.
TypeScript instrumentation pattern
The following example keeps telemetry independent from a specific model SDK. It records one parent route span and one child span for each attempt.
import { context, SpanStatusCode, trace } from "@opentelemetry/api";

const tracer = trace.getTracer("ai-gateway");

type ModelAttempt = {
  provider: string;
  model: string;
  reason: "primary" | "retry" | "fallback";
};

export async function runModelRoute(
  attempts: ModelAttempt[],
  callModel: (attempt: ModelAttempt) => Promise<{
    text: string;
    usage?: { inputTokens?: number; outputTokens?: number };
    providerRequestId?: string;
  }>,
) {
  return tracer.startActiveSpan("llm.route", async (routeSpan) => {
    routeSpan.setAttribute("app.llm.route", "support-default");
    routeSpan.setAttribute("app.llm.attempt_limit", attempts.length);

    try {
      for (const [index, attempt] of attempts.entries()) {
        const result = await tracer.startActiveSpan(
          "llm.attempt",
          { attributes: {
            "gen_ai.system": attempt.provider,
            "gen_ai.request.model": attempt.model,
            "app.llm.attempt": index + 1,
            "app.llm.reason": attempt.reason,
          } },
          context.active(),
          async (attemptSpan) => {
            const startedAt = performance.now();

            try {
              const response = await callModel(attempt);
              const valid = response.text.trim().length > 0;

              attemptSpan.setAttribute("app.llm.validated", valid);
              attemptSpan.setAttribute(
                "gen_ai.usage.input_tokens",
                response.usage?.inputTokens ?? 0,
              );
              attemptSpan.setAttribute(
                "gen_ai.usage.output_tokens",
                response.usage?.outputTokens ?? 0,
              );
              attemptSpan.setAttribute(
                "app.llm.latency_ms",
                performance.now() - startedAt,
              );

              if (!valid) {
                throw new Error("response_validation_failed");
              }

              attemptSpan.setStatus({ code: SpanStatusCode.OK });
              return response;
            } catch (error) {
              attemptSpan.recordException(error as Error);
              attemptSpan.setStatus({
                code: SpanStatusCode.ERROR,
                message: (error as Error).message,
              });
              return null;
            } finally {
              attemptSpan.end();
            }
          },
        );

        if (result) {
          routeSpan.setAttribute("app.llm.selected_attempt", index + 1);
          routeSpan.setStatus({ code: SpanStatusCode.OK });
          return result;
        }
      }

      throw new Error("llm_route_exhausted");
    } catch (error) {
      routeSpan.recordException(error as Error);
      routeSpan.setStatus({
        code: SpanStatusCode.ERROR,
        message: (error as Error).message,
      });
      throw error;
    } finally {
      routeSpan.end();
    }
  });
}
In production, add your metric counters and structured log events alongside the spans. Also capture provider request identifiers when available; they are often essential when escalating an incident to a model provider. Keep those identifiers out of public error messages.
Logs without prompt leakage
The safest default is metadata-first logging.
Log by default
- Internal request and trace IDs
- Provider request ID
- Feature and route name
- Provider, model, and deployment alias
- Prompt template version
- Parameters such as temperature and maximum output tokens
- Token usage
- Latency and time to first token
- Error class and retry decision
- Validator result
- Sanitized tool names
Do not log by default
- Raw prompts or responses
- API keys or authorization headers
- Customer secrets
- Retrieved documents
- Tool arguments containing personal or regulated data
- Full file paths or database records
- Signed URLs
When content capture is necessary for debugging or evaluation, sample it separately, redact it before storage, restrict access, encrypt it, and set a short retention period. The secure API key management guide covers the adjacent controls for secrets, logging, rotation, and incident response.
SLOs for LLM-backed features
An LLM service-level objective should describe the user-visible feature, not the provider account.
Example SLOs for a structured support-reply feature:
| SLO | Example target |
|---|---|
| Validated availability | 99.5% of eligible requests return contract-valid output |
| Interactive latency | 95% produce the first token within 1.5 seconds |
| Completion latency | 95% complete within 8 seconds |
| Cost guardrail | 99% remain below the per-request cost ceiling |
| Fallback containment | Fewer than 3% require a fallback during a rolling hour |
These numbers are examples, not universal targets. Set them from user expectations, task complexity, provider behavior, and unit economics.
Use error budgets to decide when to slow feature releases, tighten route policy, or shift traffic. A provider can meet its own availability target while your product misses its SLO because queueing, tools, validation, or fallback behavior adds failures.
Alert on symptoms, diagnose with causes
Page an operator for user impact. Use lower-severity alerts or dashboard annotations for likely causes.
Page-worthy symptoms
- Validated success rate breaches the SLO
- p95 time to first token exceeds the user-facing threshold
- Exhausted route rate rises sharply
- Cost per accepted task exceeds the guardrail
- A critical feature has no healthy contract-compatible target
Diagnostic signals
- One provider's 429 rate rises
- One model's schema failure rate changes
- Retry amplification increases
- Queue wait grows
- Circuit breaker opens
- Token usage shifts after a prompt release
Avoid paging on every provider 5xx. If fallback is working and users still receive valid responses inside the latency budget, the event may require investigation without waking the on-call engineer.
A three-dashboard operating model
Dashboard 1: User experience
Show validated availability, latency, time to first token, task completion, and user-visible errors by feature.
Dashboard 2: Routing and providers
Show traffic share, provider errors, retries, fallbacks, circuit breakers, route exhaustion, and latency by model and target.
Dashboard 3: Usage and economics
Show tokens, estimated spend, reconciled spend, cost per accepted task, budget variance, and top features by cost.
Keep deployment and prompt-version annotations on all three. Otherwise a regression that begins immediately after a release can look like random provider variance.
Rollout checklist
- Define one versioned event schema.
- Generate an internal request ID at the product boundary.
- Propagate trace context through queues, tools, and model calls.
- Create a child span for every model attempt.
- Record provider request IDs when returned.
- Add deterministic output validation.
- Track retry and fallback reasons explicitly.
- Calculate estimated cost from a versioned price table.
- Reconcile estimates with authoritative usage or billing exports.
- Build one user-outcome dashboard before provider dashboards.
- Set an SLO for validated success and latency.
- Redact or exclude prompts, responses, secrets, and sensitive tool data.
- Run failure tests for timeout, 429, 5xx, malformed output, and route exhaustion.
- Review label cardinality before enabling metrics in production.
- Sample traces by risk: retain errors and slow requests more heavily than routine successes.
Common observability mistakes
Treating every 200 as success
Add contract validators and report validated success separately.
Logging raw prompts for every request
This creates privacy, security, retention, and cost problems. Prefer metadata and controlled sampling.
Hiding retries inside one duration
Create one span and one event per attempt so operators can see amplification.
Using model names as the only route identity
Track provider, deployment or account alias, region, and route policy. The same model can behave differently across targets.
Alerting on average latency
Averages hide tail pain. Use p95 and p99, and separate time to first token from total completion time.
Trusting estimated cost forever
Price tables, cache treatment, and provider accounting can change. Reconcile estimates against billing data and record the price-table version.
Letting telemetry labels grow without bounds
Request IDs and customer identifiers belong in traces or logs, not metric labels.
Where an AI API gateway helps
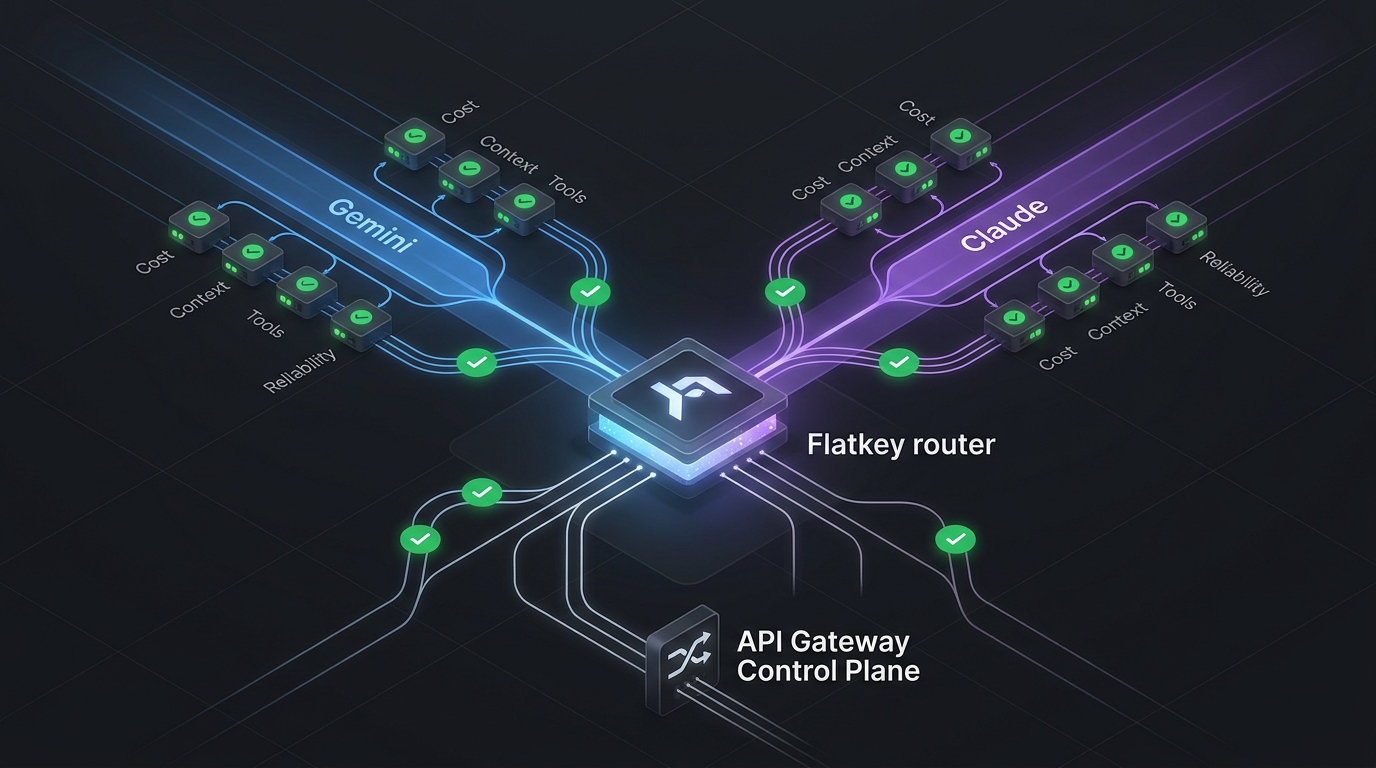
Multi-provider applications otherwise need separate adapters for authentication, model naming, retries, usage fields, errors, and billing exports. A gateway can reduce that integration surface by giving the application one stable API boundary while preserving provider and model details in internal telemetry.
Flatkey provides one API key, one OpenAI-compatible endpoint, and access to models across major providers. That makes it possible to centralize the application-side telemetry contract even when workloads use different text, image, or video models. The gateway does not replace product-level observability: your application must still record the feature, prompt version, validation result, user-visible latency, and accepted-task outcome.
If your team is consolidating providers, start with the AI API gateway architecture guide, then add the telemetry contract in this article before moving production traffic.
Frequently asked questions
What is LLM API observability?
LLM API observability is the collection and correlation of metrics, traces, logs, quality checks, usage, and cost data for model-powered features. It explains both provider behavior and whether the application returned a valid user outcome.
What should I monitor for an LLM API?
Monitor validated success rate, end-to-end latency, time to first token, provider latency, 429 and 5xx rates, retries, fallbacks, token usage, estimated cost, cost per accepted task, and output-contract failures.
Should prompts and responses be stored in traces?
Not by default. Store metadata first. Capture content only for a defined debugging or evaluation purpose with redaction, access controls, encryption, sampling, and a retention policy.
What is the difference between LLM monitoring and LLM observability?
Monitoring tells you that a known metric crossed a threshold. Observability gives you enough correlated evidence to investigate new failure modes across the application, route, provider, model, tools, and output contract.
How do I calculate LLM cost per request?
Multiply billable input, output, cached-input, media, or other usage units by a versioned price table, then add the cost of retries and fallback attempts. Reconcile the estimate with provider or gateway billing data.
Which request ID should I store?
Create your own internal request ID and trace ID, then also store the provider request ID when the API returns one. The internal IDs connect your systems; the provider ID helps with external support and incident escalation.
Build the telemetry contract before the incident
The best time to decide what a model call should record is before production traffic arrives. Start with validated success, latency distributions, one span per attempt, bounded metric labels, metadata-first logs, and cost per accepted task. Then test the system by forcing the failures you expect the router to handle.
That foundation turns a vague report—“the AI feature is slow and expensive”—into a traceable decision: which feature, which route, which model, which attempt, which failure, how much delay, and how much cost.
Explore Flatkey pricing when you are ready to compare multi-model routes behind one OpenAI-compatible API.