Once an AI product uses several providers, models, or API keys, billing stops being a simple invoice check. Engineering needs request-level evidence. Finance needs a number it can reconcile. Operations needs to know which team, workload, and policy created the change.
A unified AI billing dashboard should connect those views. It should bring usage, cost, API keys, quotas, balances, and recharge records into one operating surface so a buyer can move from “spend increased” to “this workload, owner, model, and action caused it.”
This guide gives engineering managers and operations buyers a practical framework for evaluating that dashboard before signing a contract. It includes 12 buying questions, a weighted scorecard, a live-demo script, and the warning signs that usually create more spreadsheet work after purchase.
Quick Answer: What Should a Unified AI Billing Dashboard Include?
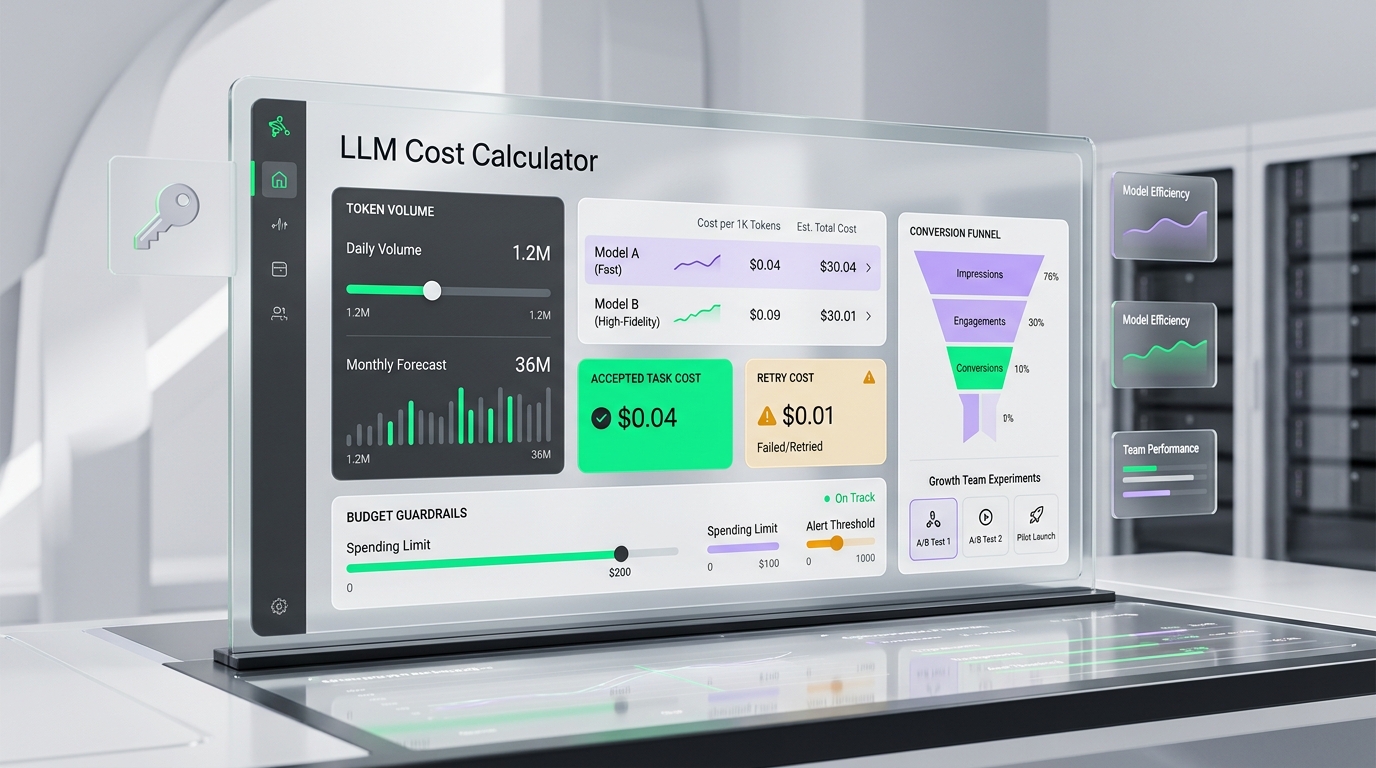
At minimum, a unified AI billing dashboard should show:
- Current balance, committed credits, and recharge history.
- Usage and cost by model, provider, API key, team, and environment.
- Quota consumption and remaining allowance.
- Request logs that explain metered usage.
- Key ownership, status, and last-used evidence.
- Exportable data for finance and internal reporting.
- Alerts or clear thresholds for abnormal usage and low balances.
- A reliable path from a summary metric to the underlying request or policy.
The dashboard does not need to put every metric on one screen. It does need to preserve a clear chain from money to usage, from usage to a workload, and from a workload to an accountable owner.
Why Separate Provider Dashboards Break Down
One provider account can be manageable. The operating burden changes when a product adds a second text model, an image endpoint, a video model, an evaluation environment, and separate production keys.
The team may now have:
- different billing units across tokens, images, audio, and video;
- prepaid balances in one account and monthly invoices in another;
- several API keys with inconsistent names and owners;
- quota windows that do not match internal budget periods;
- retries and fallback calls that appear in separate consoles;
- finance exports that require manual normalization;
- recharge records disconnected from the workloads that consumed them.
The result is not only inconvenient reporting. It weakens accountability. A finance owner may see a charge without knowing which product feature created it. An engineering manager may see a latency or reliability incident without seeing its full cost. A buyer may approve more credits without knowing whether a routing change, retry loop, or new workload caused the increase.
A unified dashboard is valuable when it reduces that reconstruction work.
Start With the Decisions the Dashboard Must Support
Do not begin a vendor evaluation by comparing screenshots. Begin with the decisions your team needs to make.
| Operating question | Minimum evidence | Expected action |
|---|---|---|
| Why did spend increase? | Cost by time, key, model, provider, and workload | Investigate, approve, cap, or reroute |
| Who owns the traffic? | Key owner, team, project, and environment | Assign follow-up or budget ownership |
| Are we close to a limit? | Quota window, usage, remaining allowance, and alert state | Recharge, throttle, redistribute, or stop |
| Did retries inflate the bill? | Request outcome, retry count, fallback path, and final cost | Fix policy or provider routing |
| Can finance reconcile the total? | Opening balance, charges, credits, recharges, and closing balance | Close the period with evidence |
| Is one customer or feature driving cost? | Tenant or workload tags mapped to metered usage | Reprice, optimize, or enforce a limit |
| Did a configuration change cause the shift? | Change timestamp plus before-and-after policy | Revert or approve the new behavior |
If a dashboard cannot support these decisions, it is a reporting surface rather than an operating surface.
1. Does It Show One Reconciled Cost Total?
The top-line number should have a defined scope. Ask whether it represents provider cost, gateway charges, plan consumption, taxes, credits, adjustments, or some combination.
Then test whether the total can be reconciled:
opening balance
+ recharges and credits
- metered usage and adjustments
= closing balance
The dashboard should make each component visible for the same date range and timezone. If the interface shows a spend chart but cannot explain how the current balance changed, finance will still need a parallel ledger.
Buying test: Pick a completed day and ask the vendor to rebuild the closing balance from visible records.
2. Can You Break Cost Down by the Way Your Company Operates?
Model and provider are necessary dimensions, but they are rarely enough for accountability.
Look for cost breakdowns by:
- API key;
- team or cost center;
- product feature or workflow;
- development, staging, production, and evaluation environments;
- customer or tenant identifier when policy allows it;
- model, provider, route, and modality;
- successful, failed, retried, and fallback traffic.
The most important dimensions are the ones already used in your incident, budgeting, and ownership processes. If your company budgets by team but the dashboard can only group by provider, the operating model still depends on manual mapping.
Buying test: Ask the vendor to isolate one production feature and show its cost for the last seven days without exporting to a spreadsheet first.
3. Can a Summary Metric Lead to Request-Level Evidence?
A useful chart is an entry point, not the final answer. Buyers should be able to move from a spend spike to the requests that explain it.
Request-level evidence may include:
- timestamp and request identifier;
- API key or safe key alias;
- selected model and provider;
- input, cached-input, output, image, audio, or video units;
- status, error class, retry count, and fallback outcome;
- latency and final metered cost;
- workload or tenant tags;
- the pricing or rate version used for calculation.
Sensitive prompts and outputs do not need to appear in a billing view. In many environments, they should not. The dashboard should still retain enough metadata to explain the bill without exposing secrets or customer content.
Buying test: Select one unusual charge and ask the vendor to trace it from the dashboard total to a specific request record.
4. Does the Key Inventory Create Real Accountability?
One gateway account does not mean one shared API key. Teams still need separate credentials for environments, workloads, customers, and automation.
For each key, the dashboard should show:
- a human-readable name;
- owner, team, and environment;
- creation date and last-used date;
- status such as active, restricted, expired, or revoked;
- allowed models or routes;
- quota or budget policy;
- usage and cost attributable to that key.
The objective is not to expose the secret value. It is to connect every active credential to an owner and a policy. For a deeper control-plane checklist, use the secure API key management guide.
Buying test: Ask for a list of active keys with no owner, no recent use, or no quota policy.
5. Are Quotas Expressed in Operational Terms?
“Quota available” is too vague. A buyer needs to know:
- what is being limited: spend, tokens, requests, images, video seconds, or another unit;
- the reset window and timezone;
- whether the quota is hard, soft, or alert-only;
- the scope: account, team, key, model, route, or customer;
- current consumption and remaining allowance;
- what happens when the threshold is reached;
- whether retries and fallback calls consume the same quota.
Different workloads need different controls. A production assistant may need a graceful fallback. An internal batch job may need a hard stop. An evaluation environment may need a small daily cap.
Buying test: Configure a low test quota and demonstrate the warning, enforcement behavior, and audit record.
6. Can You Explain Recharge and Credit History?
Prepaid and hybrid billing models add another layer of operational evidence. A recharge record should include:
- timestamp;
- amount and currency;
- payment or invoice reference;
- actor or funding source;
- promotional or manual credits;
- refunds or adjustments;
- resulting balance;
- status for pending, completed, or failed transactions.
Buyers should also ask how plan allowances and pay-as-you-go balances interact. The goal is to prevent a situation where engineering sees available service but finance cannot explain which pool funded it.
Buying test: Ask the vendor to separate purchased funds, promotional credits, plan allowance, usage charges, and manual adjustments for one billing period.
7. Does the Dashboard Normalize Different Billing Units?
Text, image, audio, and video workloads should not be flattened into request counts.
A dashboard should preserve the native unit behind each charge while also providing a normalized cost view. For example, a request log may need to show tokens for a text call, generated images for an image call, and seconds or jobs for media generation.
Without that distinction, a request-volume chart can make an expensive media workload look small or make a high-volume text workload look disproportionately important.
Buying test: Compare a text workload and a media workload in the same date range. Confirm that both the native units and normalized costs remain visible.
8. Can You Separate Product Spend From Failure Spend?
Failed requests can still consume time, quota, or billable units. Retries and fallbacks can multiply the cost of a single user action.
Look for the ability to separate:
- first-attempt success;
- provider errors;
- client errors;
- rate limits and timeouts;
- automatic retries;
- fallback requests;
- duplicate or abandoned work;
- final successful outcomes.
This makes a critical metric possible:
effective cost per successful task =
total workload cost / accepted task outcomes
The dashboard may not calculate this business metric automatically, but it should provide the usage and outcome data needed to calculate it.
Buying test: Ask how much a known retry-heavy workflow cost before and after the retry policy changed.
9. Are Alerts Actionable, Not Merely Informational?
An alert should identify the owner, scope, threshold, and recommended next action. Useful examples include:
- low balance;
- quota at 50%, 80%, or 100%;
- spend above a daily or weekly baseline;
- an inactive key becoming active;
- a new model or route consuming production traffic;
- a sudden increase in retries or fallback cost;
- a recharge failure.
Ask whether alerts can be configured by team, key, workload, or environment. One account-wide threshold is rarely enough once several teams share the same access layer.
Buying test: Trigger a safe test threshold and confirm the notification includes enough context to identify the owner and next step.
10. Can Finance Export and Reconcile the Data?
Dashboard access is useful for investigation. Period close usually requires structured exports.
Evaluate:
- CSV or API access;
- stable column names and identifiers;
- timezone and currency handling;
- invoice and payment references;
- cost-center or team dimensions;
- historical retention;
- export latency and completeness;
- treatment of credits, refunds, and adjustments.
Also ask whether the exported total matches the dashboard and invoice for the same scope. A beautiful dashboard with an irreconcilable export creates more work, not less.
Buying test: Export a full billing period and reconcile the total to the visible balance or invoice.
11. Is the Evidence Fresh Enough for Operations?
Freshness requirements differ by decision.
- Incident response may need request evidence within minutes.
- Quota management may need near-real-time consumption.
- Finance reporting may tolerate a daily finalized view.
- Provider adjustments may arrive later and need a visible correction state.
The dashboard should label delayed, estimated, pending, and finalized data. An unlabeled number invites teams to make operational decisions using incomplete evidence.
Buying test: Generate a small test workload and measure how long it takes to appear in usage, cost, quota, and export views.
12. Can the Vendor Demonstrate the Entire Evidence Chain?
The strongest buying test is a complete walkthrough:
- Create or select a scoped API key.
- Assign an owner, environment, and quota.
- Send requests through two models or routes.
- Trigger one controlled failure or fallback.
- Find the usage and final cost.
- Show the effect on quota and balance.
- Locate the request records.
- Export the period data.
- Show the recharge or payment record that funded the balance.
- Revoke or restrict the test key and verify the change record.
This is more useful than a polished product tour because it tests whether billing, usage, keys, quotas, and recharge history are actually connected.
Unified AI Billing Dashboard Scorecard
Use a weighted scorecard so visual polish does not outweigh operational coverage.
Score each category from 0 to 5:
- 0: Not available.
- 1: Visible only at account level.
- 2: Available with major manual work.
- 3: Usable for routine operations.
- 4: Strong drill-down, ownership, and exports.
- 5: Complete evidence chain with automation and controls.
| Evaluation category | Weight | Vendor score (0–5) | Weighted result |
|---|---|---|---|
| Reconciled billing and balances | 15 | ||
| Cost allocation dimensions | 15 | ||
| Request-level usage evidence | 10 | ||
| API key ownership and lifecycle | 10 | ||
| Quotas and enforcement | 10 | ||
| Recharge and credit history | 10 | ||
| Multi-modal unit normalization | 5 | ||
| Retry and fallback cost visibility | 5 | ||
| Alerts and anomaly context | 5 | ||
| Finance exports and API access | 10 | ||
| Data freshness and correction states | 5 | ||
| Total | 100 |
Calculate the final score as:
weighted result = (vendor score / 5) × category weight
Do not use the total alone. Mark any non-negotiable requirement as a pass/fail gate. A vendor that cannot enforce a production quota or produce a finance export may be unacceptable even if its overall score is high.
Red Flags During a Dashboard Evaluation
Treat these as warning signs:
- The top-line cost cannot be reconciled to balance changes.
- Provider, model, and key are the only allocation dimensions.
- Request logs omit metered units or final cost.
- API keys have no owner, environment, or last-used evidence.
- Quotas exist only at the whole-account level.
- Recharge history is separate from the balance ledger.
- Failed, retried, and fallback traffic are combined with successful work.
- Exports do not match dashboard totals.
- Data freshness is not labeled.
- The vendor cannot complete an end-to-end demo using your sample workflow.
Any one of these gaps may be manageable for a small prototype. Several together indicate that the buyer will maintain a second control system in spreadsheets, scripts, or internal dashboards.
How Flatkey Fits the Evaluation Framework
Flatkey is designed to give teams one access layer across multiple AI models while centralizing the operating evidence around that access. In one dashboard, teams can review billing, usage, API keys, quotas, balances, and recharge records instead of reconstructing the picture across separate provider accounts.
That makes the buying conversation concrete: define the workloads and ownership boundaries you need, test the evidence chain, and choose a plan that matches your operating requirements. Review the Flatkey pricing page for current self-serve options and enterprise paths, or compare the dashboard against the scorecard in this guide during an evaluation.
Frequently Asked Questions
What is a unified AI billing dashboard?
A unified AI billing dashboard is an operating view that combines cost, usage, balances, API keys, quotas, and funding records across multiple AI models or providers. Its purpose is to connect each charge to the workload, credential, owner, and policy that created it.
Is one total-spend chart enough?
No. A total-spend chart can show that cost changed, but it cannot explain why. Buyers should expect drill-down by key, team, environment, workload, model, provider, route, and request outcome.
Should prompt and response content appear in billing logs?
Not necessarily. Sensitive content can be excluded or redacted while the dashboard retains billing metadata such as request ID, model, metered units, status, latency, owner, and cost.
What is the most important demo request?
Ask the vendor to complete an end-to-end evidence chain: issue a scoped key, send a request, show its cost and quota effect, trace it in request logs, export the data, and reconcile it to the balance ledger.
How should teams compare dashboard vendors?
Use weighted criteria for billing reconciliation, allocation, request evidence, key management, quotas, recharge history, exports, and freshness. Keep hard requirements as pass/fail gates rather than relying only on the total score.
Make the Dashboard Prove Accountability
The best unified AI billing dashboard is not the one with the most charts. It is the one that shortens the path from a financial or operational signal to an accountable decision.
Before buying, test whether the dashboard can answer four questions without a spreadsheet:
- What changed?
- Which workload and key caused it?
- Who owns the decision?
- What should happen next?
If the product can connect billing, usage, keys, quotas, and recharge history well enough to answer those questions, it can become part of the operating system for an AI product—not just another console to check.