LLM Cost Calculator for Growth Teams: A Practical Workflow
An LLM cost calculator is only useful if it measures the full cost of a real workflow, not just a token rate. Growth teams care about launch budgets, experiment velocity, and whether a model choice creates hidden review or retry spend after the first response.
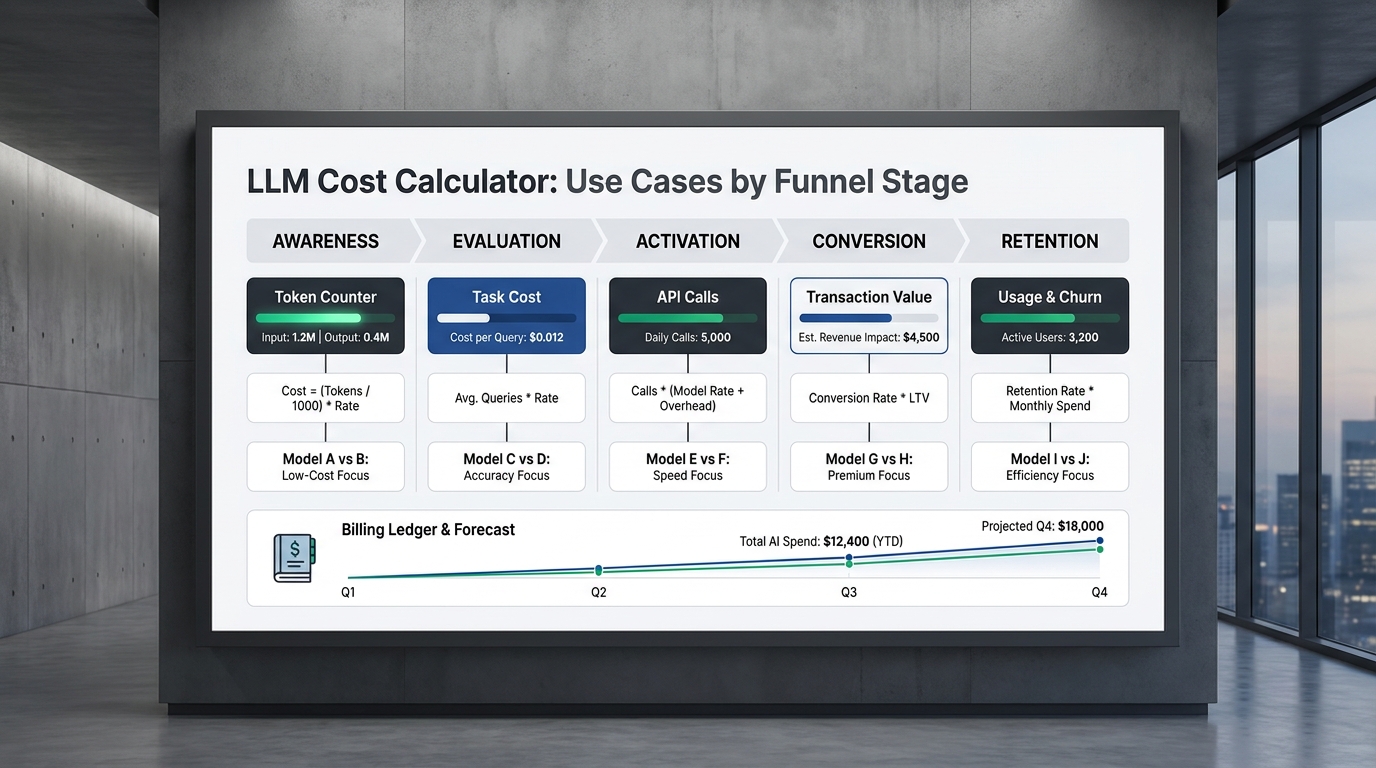
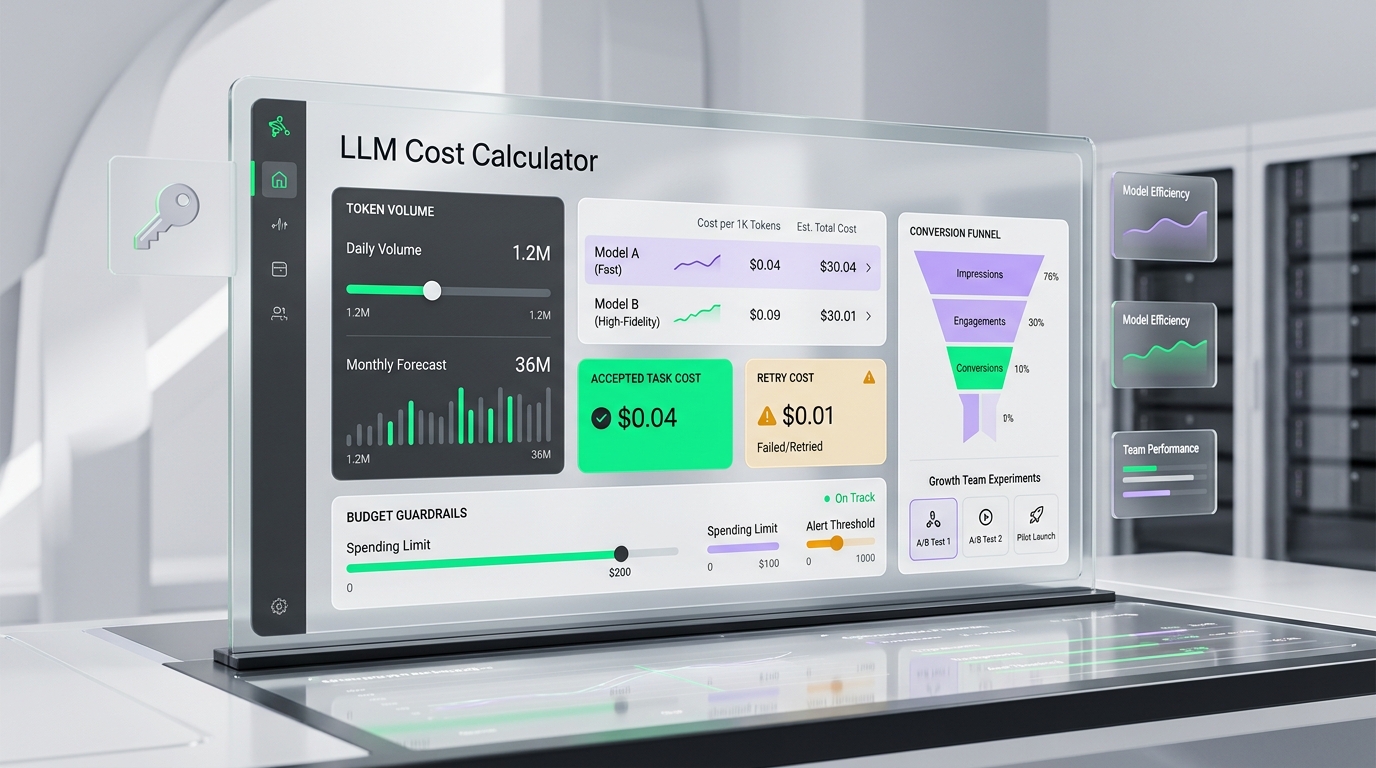
The useful unit is cost per accepted task: the total spend required to produce one output that the campaign, agent, workflow, or product surface can actually use. That means an LLM cost calculator should track the model bill, retries, fallback calls, tool charges, human review time, and the operational overhead of running the test.
This guide gives growth teams a practical LLM cost calculator workflow they can use before launching a new AI feature, content pipeline, outbound experiment, support assistant, or research agent.
The Short Version
Use an LLM cost calculator when model spend is tied to a repeatable growth workflow, not a one-off prompt. The calculator should answer five questions:
- How much does one started request cost?
- How many started requests become accepted outputs?
- What do retries, fallback, tool calls, and review add to the bill?
- Which model or route has the lowest cost per accepted task?
- At what threshold should the team stop, cap, or reroute the experiment?
If you only compare price per million tokens, you will miss the cost that matters most: the money spent on outputs that never ship.
Why Growth Teams Need A Different LLM Cost Calculator
Engineering teams often start with model-level math: input tokens times input price, plus output tokens times output price. That is necessary, but it is not enough for a growth team.
Growth workflows usually have more moving parts:
- multiple prompts in one campaign or automation
- test cells with different audiences, channels, and offers
- human review before publish or send
- enrichment tools, search tools, image tools, or data APIs
- retries after rate limits, schema failures, or low-confidence outputs
- fallback to a stronger model when a cheaper one misses the task
- budget caps by customer, market, account, or experiment
An LLM cost calculator for this environment must connect model spend to the business object the team actually manages: a qualified lead, approved asset, routed ticket, enriched account, accepted research brief, or converted experiment cell.
The Core Formula
Start with request-level model cost:
request cost =
  input tokens * input token rate
  + cached input tokens * cached input rate
  + output tokens * output token rate
  + tool, image, audio, video, search, or data charges
Then move up to accepted-task cost:
cost per accepted task =
  (model cost
   + retry cost
   + fallback cost
   + tool and data cost
   + human review cost
   + failure recovery cost
   + operating overhead)
  / accepted tasks
This second formula is where most useful decisions happen. A cheaper model can lose if it produces more invalid outputs. A stronger model can win if it reduces review time, retry loops, or downstream corrections.
The article on AI API spend forecasting covers broader monthly planning. This LLM cost calculator workflow is narrower: it helps a growth team decide whether one specific experiment or automation should run, scale, stop, or move to another route.
Worksheet: Fields To Put In The Calculator
Use one row per workflow, not one blended account total. A landing-page copy test, lead enrichment workflow, support summarizer, and coding-agent evaluation should not share one average.
| Field | What To Enter | Why It Matters |
|---|---|---|
| Workflow | Campaign, feature, agent, or automation name | Keeps spend tied to a decision owner |
| Route | Direct provider, gateway, model family, or routing policy | Makes model and provider choices comparable |
| Model | Exact model used for the request | Avoids vague "AI spend" reporting |
| Requests started | Every first attempt | Defines the traffic base |
| Retry attempts | Automatic repeats after failures | Shows duplicate spend |
| Fallback attempts | Calls moved to another model or provider | Separates failover from ordinary retries |
| Accepted tasks | Outputs that passed QA or business rules | Creates the denominator that matters |
| Average input tokens | Prompt, context, and tool instructions | Exposes oversized prompts |
| Average output tokens | Generated answer, asset, or structured object | Exposes verbosity and schema drift |
| Cached input share | Reused stable context, if supported | Shows whether caching can materially help |
| Tool and data charges | Search, browser, data API, image, audio, or video charges | Prevents non-token costs from disappearing |
| Review minutes | Human review per output | Converts approval friction into money |
| Remediation cost | Reruns, manual repair, refunds, support time | Captures failed output cost |
| Cost per accepted task | Total cost divided by accepted tasks | The main comparison metric |
For internal reporting, keep the raw token and request fields visible. For leadership review, show the accepted-task number first.
Example Calculator Logic
Use placeholders until you have real production data:
accepted tasks = requests started * acceptance rate

model spend =
  requests started
  * (average input tokens * input rate
     + average output tokens * output rate)

retry spend =
  retry attempts
  * retry request cost

fallback spend =
  fallback attempts
  * fallback request cost

review spend =
  review minutes
  * loaded reviewer cost per minute

cost per accepted task =
  (model spend + retry spend + fallback spend + tool spend + review spend)
  / accepted tasks
Then run the same workload across candidate routes. Do not compare a cheap model on easy traffic against a premium model on hard traffic. Use the same prompt set, acceptance rules, traffic mix, and review rubric.
A Practical Comparison Matrix
The LLM cost calculator should make routing tradeoffs obvious.
| Option | Best For | Cost Risk | Quality Risk | Decision Rule |
|---|---|---|---|---|
| Single low-cost model | Simple classification, extraction, tagging, first drafts | Retries and review can erase savings | Higher on complex tasks | Keep if acceptance stays above the floor |
| Single premium model | High-stakes reasoning, difficult writing, complex agents | Easy work pays premium rates | Lower, but not zero | Use when failure cost is higher than model cost |
| Small-to-large fallback | Mixed workloads with clear failure detection | Duplicate spend on fallback paths | Depends on fallback trigger quality | Use when first-pass savings beat fallback cost |
| Task-based routing | Growth teams with several workflow types | Rule maintenance and observability | Misclassification | Use when task classes are stable |
| Gateway plus calculator | Teams comparing providers, models, and budgets often | Requires routing and billing discipline | Depends on model choice | Use when one dashboard and one key reduce operating overhead |
This is where Flatkey can fit the workflow. Flatkey gives teams one key and one billing surface across models and tools, while the public pricing and model directory pages give a current place to compare model options before committing a campaign or automation to a route.
What To Measure Before A Growth Launch
Before increasing traffic, collect a small baseline:
| Baseline Metric | Minimum Useful Sample | Pass Condition |
|---|---|---|
| Acceptance rate | 100 to 300 representative tasks | Meets the workflow's quality floor |
| Retry rate | Same sample as acceptance | Stable and explainable |
| Fallback rate | Same sample as acceptance | Low enough that fallback is not the default path |
| Average input tokens | All sampled requests | No obvious duplicated context |
| Average output tokens | All sampled requests | No unneeded verbosity |
| Human review minutes | Reviewed outputs | Does not erase token savings |
| Cost per accepted task | Accepted outputs | Below the campaign's budget limit |
The exact thresholds depend on the workflow. For a low-risk metadata task, an 85% acceptance rate may be fine. For a customer-facing message, a much higher floor may be required. The calculator should make that standard explicit.
Where Token-Only Calculators Break
Many LLM cost calculator tools stop at token math. That is useful for a first estimate, but growth workflows need additional checks.
Token-only math misses:
- failed outputs that still cost money
- duplicate requests after retries
- fallback calls to more expensive models
- reviewer time
- tool or data charges
- campaign-level budget caps
- latency cost when slow outputs miss a send window
- procurement overhead from separate provider accounts
This is why the calculator should live close to experiment tracking and usage logs. The model invoice tells you what was charged. The growth workflow tells you whether the charge created a usable result.
How To Use The Calculator During An Experiment
Run the LLM cost calculator in three stages.
1. Pre-launch Estimate
Before sending production traffic, estimate:
- expected request volume
- average prompt size
- expected output size
- expected acceptance rate
- expected review time
- retry and fallback budget
- maximum cost per accepted task
Use current model pricing pages for the rate inputs. Provider pricing, caching behavior, batch terms, and model availability can change, so recheck before committing a monthly budget.
2. Controlled Traffic Slice
Send a small, representative traffic slice through the candidate route. Keep the sample balanced across easy, medium, and hard cases. Record every retry and fallback. Do not delete failed attempts from the dataset.
Compare:
- estimated cost per accepted task
- actual cost per accepted task
- estimated acceptance rate
- actual acceptance rate
- largest reasons for rejection
If the estimate and reality diverge, fix the calculator before scaling the experiment.
3. Scale Or Stop Decision
Scale only when the workflow stays inside three guardrails:
| Guardrail | Stop Or Reroute When |
|---|---|
| Quality | Acceptance drops below the predefined floor |
| Spend | Cost per accepted task exceeds the budget limit |
| Stability | Retry, fallback, or latency spikes without a clear cause |
The calculator is not just a reporting spreadsheet. It is a control surface for growth operations.
Internal Links For Deeper Work
Use these Flatkey resources with the calculator:
- Use AI API spend forecasting when you need to forecast monthly volume across several workflows.
- Use AI API cost optimization when you need a broader savings plan after the calculator exposes the expensive paths.
- Use AI API quota limits when the calculator shows rate-limit, retry, or budget-control problems.
- Use the AI API gateway guide when direct provider accounts are becoming hard to manage.
- Review current options in Flatkey pricing and the model directory before choosing a route.
Common Mistakes
Avoid these mistakes when building an LLM cost calculator:
- using one account average for every workflow
- ignoring rejected outputs
- treating retries and fallback as free reliability
- comparing models on different task samples
- forgetting reviewer time
- counting output volume but not acceptance
- using stale model rates
- optimizing for token savings while lowering conversion quality
The last point matters most for growth teams. A lower model bill is not an improvement if the campaign produces fewer usable assets, lower reply quality, worse lead enrichment, or slower experiment cycles.
Where Flatkey Fits
Flatkey is most useful when an LLM cost calculator needs to connect spend, model choice, and route control. The current Flatkey site positions the product around one key, more models, more tools, and lower costs. The model directory gives teams a current place to compare model options by price, context, speed, and health. The pricing page frames Flatkey plans around production usage controls.
That combination matters when growth teams want to test multiple models without turning every experiment into a separate provider-account exercise. The calculator still needs good workflow data, but a unified gateway can make the inputs easier to collect and compare.
Final Checklist
Before you trust an LLM cost calculator, confirm that it includes:
- one row per workflow
- current model rates
- input, output, and cached-input fields
- retry and fallback cost
- accepted-task count
- review and remediation cost
- a stop threshold
- a route-change threshold
- an owner for budget decisions
Conclusion
An LLM cost calculator should help growth teams make decisions, not just estimate tokens. The metric to watch is cost per accepted task. Once you can see that number by workflow, route, model, and experiment, the next step becomes clearer: scale the route, cap it, improve the prompt, move work to another model, or stop the test.
If your team needs one place to compare models, route tests, and keep AI workflow spend visible, Flatkey gives the billing and routing layer an LLM cost calculator needs.
Plug in current per-token rates from our AI API pricing comparison.
FAQ
What is an LLM cost calculator?
An LLM cost calculator estimates the cost of running a language-model workflow. A useful calculator includes tokens, retries, fallback, tool charges, review time, and accepted-task count.
What metric should growth teams use?
Growth teams should use cost per accepted task because it connects AI spend to usable campaign, workflow, or product outputs.
Should an LLM cost calculator track only tokens?
No. Token math is only the starting point. The calculator should also track acceptance rate, retries, fallback, human review, tool usage, and budget thresholds.
When does a gateway help with LLM cost calculation?
A gateway helps when teams compare several providers or models, need one billing surface, and want routing decisions to be visible in the same workflow as cost review.