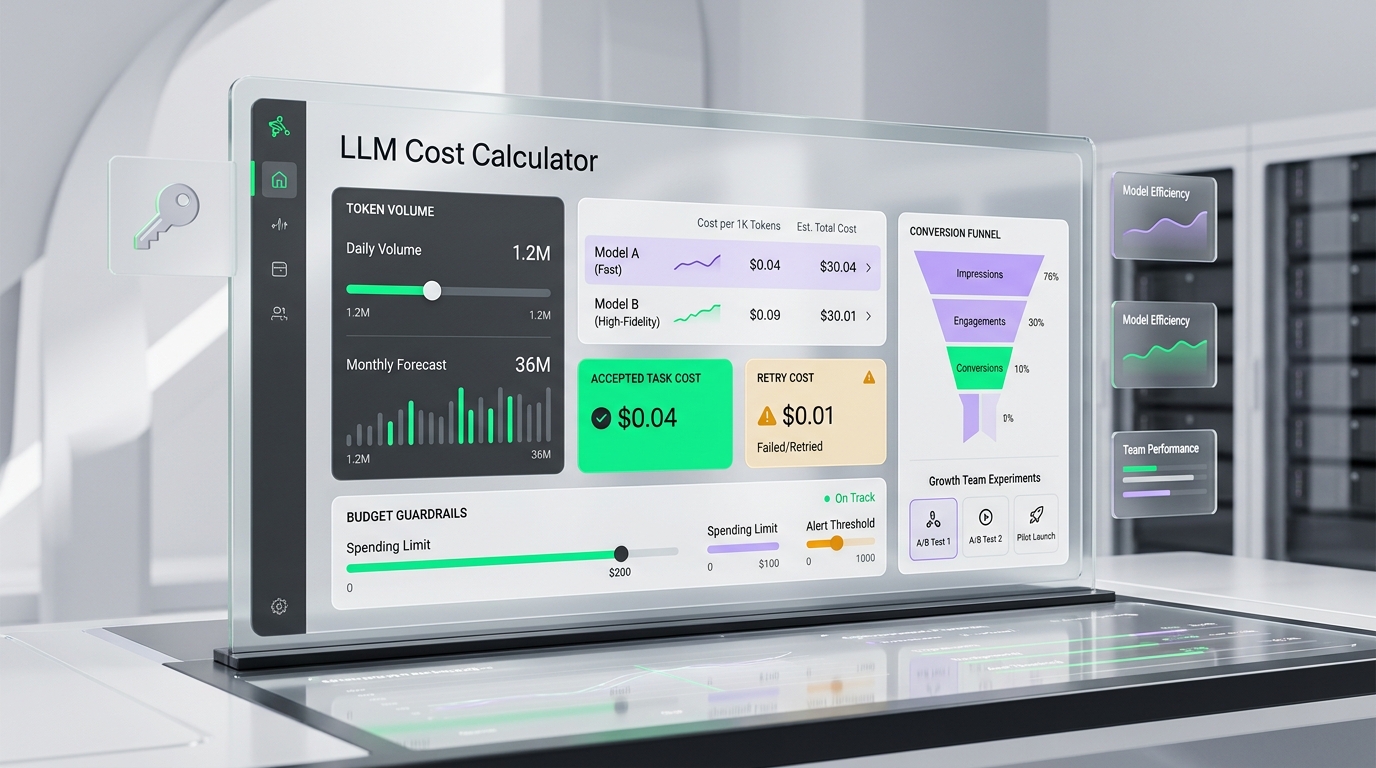
An LLM cost calculator is useful only when it answers the right business question. The same token math can support a founder estimating a new feature, a growth team planning a launch, a product manager comparing model quality, or an ops lead trying to stop a runaway agent workflow. The inputs overlap, but the decision is different at each funnel stage.
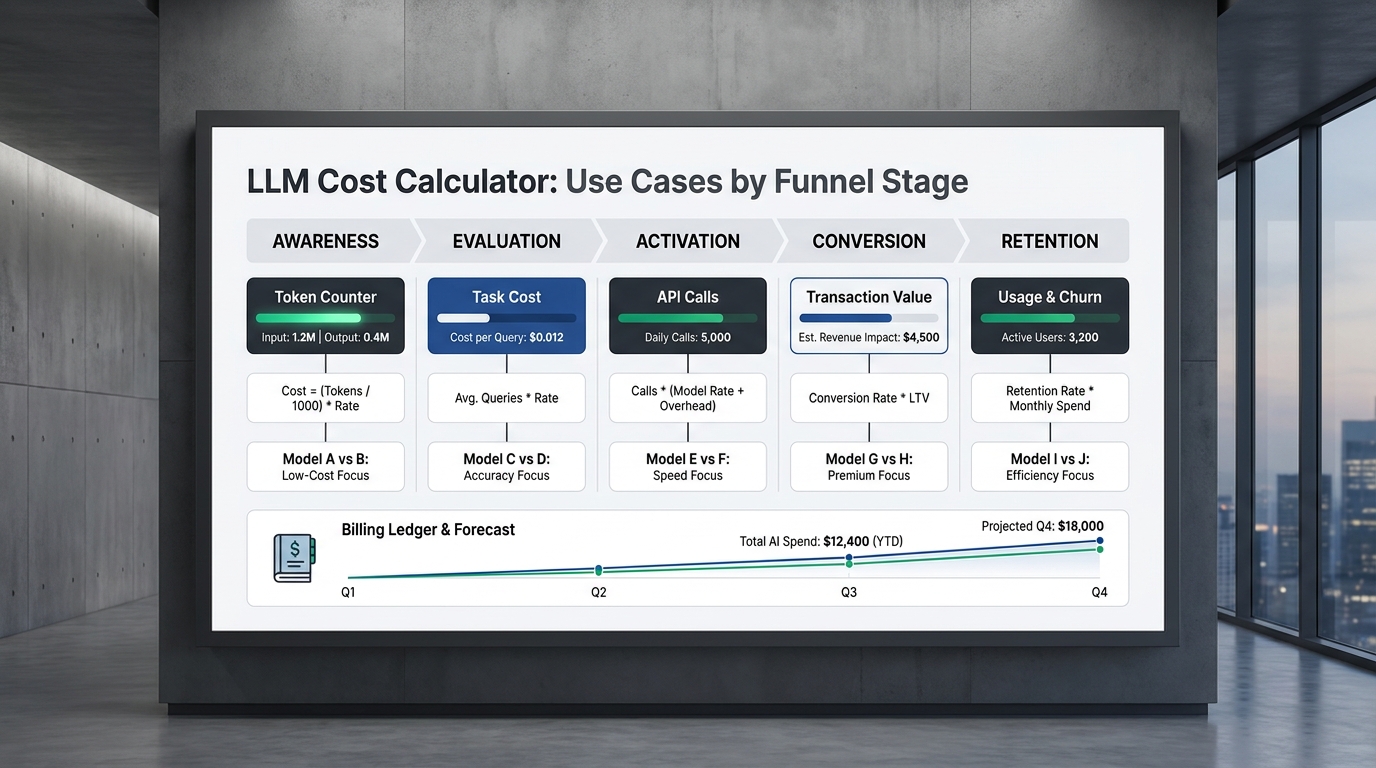
This guide maps practical LLM cost calculator use cases by funnel stage, from awareness through retention. Use it when you already understand basic token pricing and need a repeatable way to decide what to test, what to ship, and what to monitor after launch.
The Quick Answer
Use an LLM cost calculator to make one decision per funnel stage:
| Funnel stage | Calculator question | Best output |
|---|---|---|
| Awareness | Is this use case even worth exploring? | Rough monthly cost range |
| Evaluation | Which model or route should we test first? | Scenario comparison |
| Activation | Can users reach value without blowing the budget? | Cost per activated user |
| Conversion | Does AI cost fit the margin model? | Cost per qualified outcome |
| Retention | Which workload is drifting or wasting spend? | Budget guardrails and alerts |
Most teams make the calculator too generic. A better LLM cost calculator starts with the stage, then chooses the metric that maps to the next decision.
What An LLM Cost Calculator Should Measure
The base formula is simple:
estimated_cost =
  (input_tokens / 1,000,000 * input_price)
+ (output_tokens / 1,000,000 * output_price)
+ cache_write_cost
+ cached_input_cost
+ tool_call_cost
+ image_audio_or_video_cost
+ retry_and_fallback_cost
That formula is necessary, but it is not enough. It tells you the vendor bill, not whether the workload is healthy.
A practical LLM cost calculator should also track:
| Field | Why it matters |
|---|---|
| Accepted task rate | Cheap outputs are expensive if humans reject them |
| Retry rate | Hidden retries can erase model-price savings |
| Cache hit rate | Reused context changes effective input cost |
| Tool calls per task | Agents may spend more on tools than text tokens |
| Human review minutes | Some "cheap" workflows move cost to operators |
| Latency band | Slower routes can lower API cost but hurt conversion |
| Budget owner | Spend needs a team, product, or campaign owner |
For current per-token rates, always check live pricing references such as the OpenAI API pricing page, Anthropic pricing page, Google Gemini API pricing page, and the Flatkey pricing and model directory. Provider pricing pages now commonly separate input, cached input, output, batch, regional, and modality-specific costs, so stale calculator assumptions can produce the wrong answer.
Awareness Stage: Estimate Whether The Use Case Is Viable
At the awareness stage, the reader is asking: "Could AI help with this workflow, and is the cost remotely reasonable?"
The LLM cost calculator should stay rough. Do not pretend precision before you have real prompts, real output lengths, or real acceptance rates. Use ranges:
| Input | Low estimate | High estimate |
|---|---|---|
| Requests per month | 10,000 | 100,000 |
| Input tokens per request | 500 | 4,000 |
| Output tokens per request | 200 | 2,000 |
| Retry rate | 0% | 20% |
| Accepted output rate | 80% | 40% |
The decision is not "which model is cheapest?" The decision is whether the use case belongs on the roadmap. If the high estimate is still acceptable, run a prototype. If the high estimate breaks the business case, shrink the workflow before model selection: summarize less context, cap output length, defer rich media, or ask whether a rules-based step can remove part of the prompt.
Best awareness-stage use cases:
| Use case | Calculator output |
|---|---|
| New AI feature idea | Monthly API cost range |
| Content or research workflow | Cost per draft or brief |
| Internal coding assistant rollout | Cost per active developer |
| Customer support assistant | Cost per resolved ticket range |
At this stage, a good LLM cost calculator should make the next meeting shorter. It should not try to be a full procurement model.
Evaluation Stage: Compare Models And Routing Choices
At evaluation, the team has sample prompts and wants to choose a model, route, or gateway setup for testing. This is where the LLM cost calculator becomes a scenario comparison tool.
Use the same workload across every row:
| Scenario | Input tokens | Output tokens | Cache hit | Retry rate | Accepted rate | Cost per accepted task |
|---|---|---|---|---|---|---|
| Fast model | 1,200 | 450 | 20% | 12% | 72% | Calculate |
| Stronger reasoning model | 1,200 | 650 | 20% | 5% | 88% | Calculate |
| Cached context route | 1,200 | 450 | 65% | 8% | 78% | Calculate |
| Fallback route | 1,200 | 450 | 20% | 3% | 82% | Calculate |
The key metric is cost per accepted task:
cost_per_accepted_task =
  total_api_cost / accepted_outputs
This matters because lower token price does not always lower operating cost. A cheaper model that needs more retries, longer prompts, or more human repair can lose to a higher-priced model with a better accepted-output rate.
For teams using Flatkey, this stage is where a unified model directory and one OpenAI-compatible endpoint help. You can compare model prices, context length, route health, and usage in one buying workflow instead of moving between multiple provider dashboards. The calculator still needs your workload data; Flatkey supplies the billing and routing surface. For a deeper worksheet, pair this article with the LLM Cost Calculator for Growth Teams workflow.
Activation Stage: Budget The First Real User Journey
Activation is the first stage where user behavior matters. You are no longer calculating one prompt. You are calculating a journey:
activation_cost =
  signup_intake
+ first_generation
+ rewrite_or_retry
+ explanation_or_chat_followup
+ optional tool calls
An LLM cost calculator for activation should answer: "Can a new user reach the aha moment within our budget?"
Useful activation-stage metrics:
| Metric | Example use |
|---|---|
| Cost per activated user | Free trial and onboarding economics |
| Cost per successful first task | Product-led growth guardrail |
| Cost per onboarding session | Sales-assisted demo planning |
| Cost per agent setup | Developer tool activation |
This is also the right stage to add budget caps. A free user might get a lower-cost model, shorter context, or fewer retries. A qualified trial user might get a stronger model because the activation moment is worth more. A sales demo might use a premium route because the goal is trust, not unit-cost minimization.
Your LLM cost calculator should make those policies visible. If the team only sees blended monthly spend, it will not know whether activation is too expensive or retention workloads are eating the budget.
Conversion Stage: Tie AI Cost To Revenue Or Pipeline
At conversion, the calculator should stop speaking only in tokens. It should connect model spend to revenue, pipeline, or margin.
Use a funnel-cost view:
| Conversion workflow | Calculator metric | Decision |
|---|---|---|
| AI sales research | Cost per qualified account brief | Keep if it improves rep throughput |
| AI proposal drafting | Cost per accepted proposal | Keep if gross margin supports it |
| Ecommerce creative generation | Cost per approved creative | Keep if creative testing velocity improves |
| Support escalation drafting | Cost per resolved escalation | Keep if it lowers handle time |
| Developer agent workflow | Cost per merged change or accepted task | Keep if engineering cycle time improves |
The LLM cost calculator should include non-token costs here:
gross_workflow_cost =
  api_cost
+ tool_cost
+ review_minutes * loaded_hourly_rate
+ failed_output_cost
Then compare it with the value metric:
cost_as_percentage_of_value =
  gross_workflow_cost / revenue_or_pipeline_value
You do not need a perfect attribution model to make a better decision. You need a calculator that separates a cheap demo from a profitable workflow.
Retention Stage: Monitor Drift, Waste, And Route Health
Retention is where calculator logic becomes operations. After launch, the same worksheet should become a dashboard or recurring review.
Watch for:
| Signal | What it may mean |
|---|---|
| Input tokens per task rising | Prompts are accumulating context without pruning |
| Output tokens rising | Responses are too verbose or max tokens are too high |
| Cache hit rate falling | Reused context is not structured correctly |
| Retry rate rising | Prompt, model, or route quality has changed |
| Cost per accepted task rising | Users are rejecting more outputs |
| Tool calls per task rising | Agent plans are looping or over-searching |
This is where a request-level ledger matters. Flatkey positions its usage surface around one key, one balance, and per-request usage visibility across models and tools. For retention-stage cost control, that means teams can review token count, dollar spend, request IDs, budgets, and allowlists in the same operating layer instead of reconciling multiple provider exports. If this stage is your main problem, also review AI API spend forecasting and AI API quota limits.
Retention is also where alerts belong:
| Alert | Trigger |
|---|---|
| Budget owner alert | Project reaches 80% of monthly cap |
| Prompt drift alert | Median input tokens rise 25% week over week |
| Retry alert | Retry rate exceeds agreed threshold |
| Model switch alert | Fallback route becomes primary route |
| Acceptance alert | Accepted task rate drops below target |
The LLM cost calculator is no longer just a planning file. It becomes the standard for explaining why spend changed.
Copyable Funnel Calculator Template
Use this as the worksheet structure:
| Column | Description |
|---|---|
| Funnel stage | Awareness, evaluation, activation, conversion, retention |
| Workflow name | The specific task, not a broad product area |
| Owner | Team, project, campaign, or product owner |
| Requests per period | Expected monthly or weekly volume |
| Input tokens per request | Median and p90 when available |
| Output tokens per request | Median and p90 when available |
| Cached input share | Percentage of reusable context |
| Tool calls per request | Search, browser, enrichment, file, image, or other tools |
| Retry/fallback rate | Extra calls caused by errors, weak outputs, or fallback policy |
| Accepted task rate | Percentage of outputs that reach the user or business goal |
| API cost | Token, modality, and tool cost |
| Review cost | Human review or repair time |
| Cost per accepted task | Final comparison metric |
| Stage decision | Explore, test, launch, scale, cap, or retire |
Keep the stage decision explicit. Without it, the worksheet becomes another reporting artifact that everyone reads and nobody acts on.
Common Mistakes
The most common LLM cost calculator mistake is using token price as the final answer. Token price is an input. The decision metric is usually cost per accepted task, cost per activated user, or cost per qualified outcome.
Other mistakes:
| Mistake | Fix |
|---|---|
| Ignoring output tokens | Model outputs can dominate cost in verbose workflows |
| Ignoring retries | Track failed calls, weak outputs, and fallback attempts |
| Averaging all users together | Segment by funnel stage and workload owner |
| Forgetting cache behavior | Separate fresh input from cached or repeated context |
| Leaving tools out | Agent workflows may call search, browser, enrichment, image, or video tools |
| Using stale prices | Link the calculator to live pricing pages and refresh before launches |
| Comparing models on cost only | Include accepted-output rate, latency, and review burden |
Where Flatkey Fits
Flatkey is useful when the calculator needs to move from a spreadsheet into an operating workflow. A team can route model calls through one OpenAI-compatible base URL, compare models in the model directory, monitor usage and costs, and keep model and tool calls on one billing surface. The broader architecture decision is covered in the AI API gateway guide, while pricing fundamentals are covered in What Is AI Model Pricing and When Does It Matter?.
That does not remove the need for calculator discipline. You still need to define stages, owners, accepted-output metrics, and budget caps. The difference is that the usage data and controls are easier to centralize when model calls, tool calls, budgets, allowlists, and request-level usage records live in one layer.
If you are building the first version of an LLM cost calculator, start simple:
- Pick one funnel stage.
- Pick one workflow.
- Estimate request volume and token shape.
- Add retry, cache, and tool-call assumptions.
- Calculate cost per accepted task.
- Compare two or three model or route options.
- Set a budget owner and review cadence.
Then connect the calculator to live usage before the workflow scales.
Frequently Asked Questions
What is the main use case for an LLM cost calculator?
The main use case for an LLM cost calculator is deciding whether an AI workflow is worth testing, launching, scaling, or capping. The best calculator output depends on funnel stage: monthly range for awareness, cost per accepted task for evaluation, cost per activated user for activation, margin impact for conversion, and drift alerts for retention.
Should an LLM cost calculator compare model prices directly?
Yes, but direct model-price comparison is only the first layer. Compare input price, output price, cached input, batch options, latency, retry rate, accepted-output rate, and tool costs. The useful output is not "cheapest model." It is the model or route that produces the best cost per accepted task for the specific workflow.
How often should teams refresh calculator assumptions?
Refresh assumptions before a major launch, after a model switch, after a prompt rewrite, after a traffic spike, and during monthly budget review. Provider pricing and model behavior can change, so live pricing pages and request-level usage records should be the source of truth.
How does a gateway change LLM cost calculator work?
A gateway does not change the core math, but it can make the data easier to collect. If model calls, tool calls, budgets, allowlists, and request ledgers sit behind one key and one billing layer, the calculator can use one operating view instead of reconciling several provider dashboards.
Bottom Line
An LLM cost calculator should not be a generic token widget. It should be a decision system. At awareness, it sizes the opportunity. At evaluation, it compares scenarios. At activation, it protects the first user journey. At conversion, it checks margin. At retention, it explains drift.
Flatkey helps when that decision system needs live model pricing, one key, one billing layer, and request-level visibility across model and tool calls. Start with the calculator stage, then connect it to real usage before spend becomes invisible. To test the setup, start from the Flatkey docs or compare current model options in the model directory.