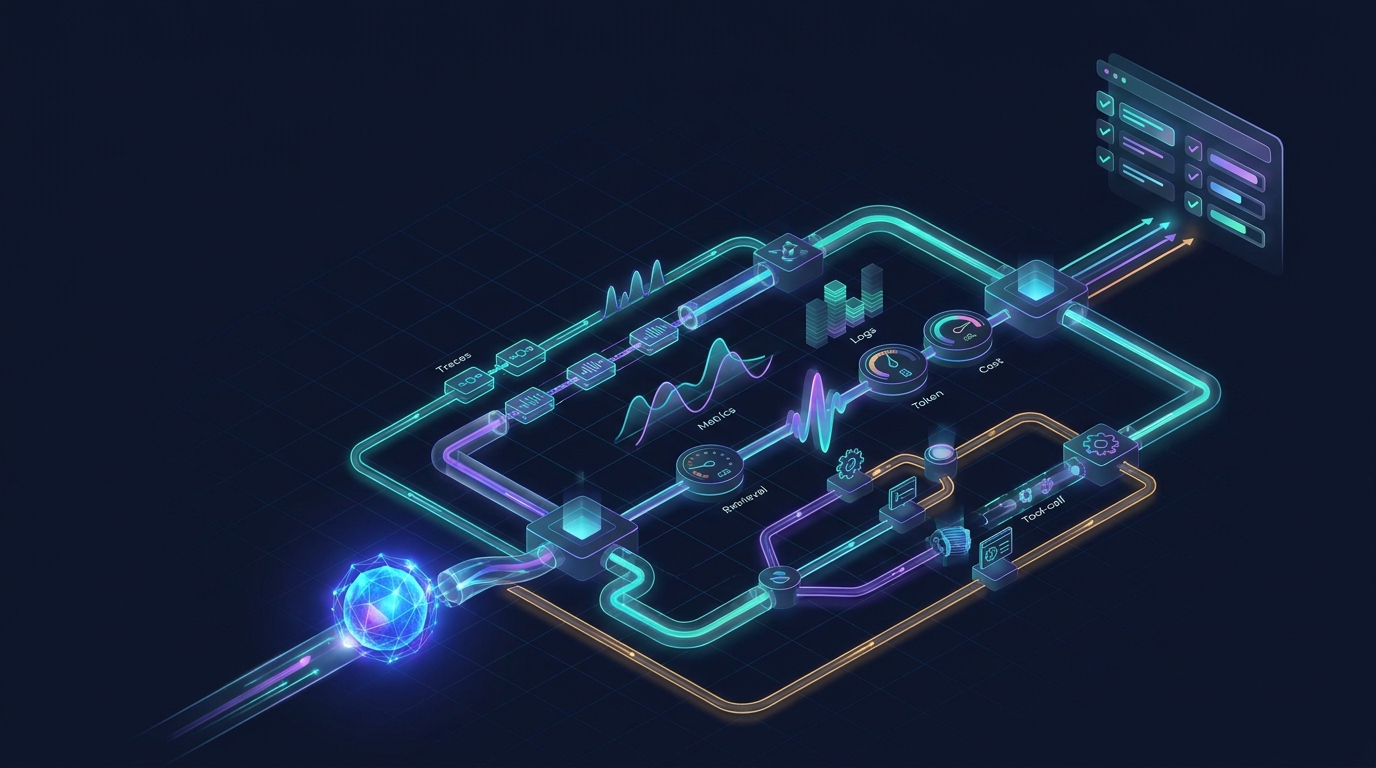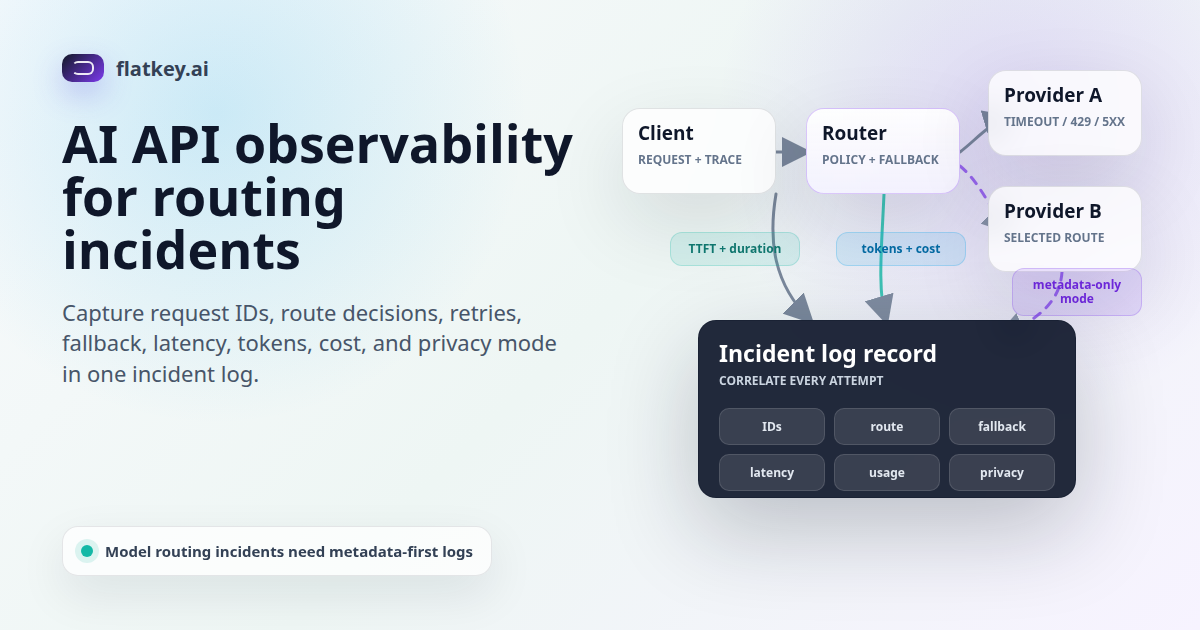
AI API observability is what lets an engineering team reconstruct a model routing incident without guessing. A user reports a timeout, a fallback model answers differently, a provider returns 429, or spend jumps after an upstream switch. The incident review needs more than a raw prompt and a status code. It needs a log record that shows the request, the route, the retry chain, the selected model, the latency profile, the usage, the cost, and the privacy controls around what was stored.
This guide is a field-level checklist for AI API observability logs in routing incidents. It is written for teams using an AI gateway, multi-provider router, or compatibility layer where one application request can pass through several possible upstream paths. The goal is not to store every prompt forever. The goal is to keep enough metadata to prove what happened while keeping sensitive input, output, tool arguments, and customer identifiers under control.
Flatkey fits this problem because its public product copy centers on one API key, an OpenAI-compatible base URL at https://router.flatkey.ai/v1, unified billing, and one dashboard for keys, usage, and routing. Flatkey also references automatic switching and load balancing across upstream accounts. Those are useful reliability features only when the logs can answer a routing question after the fact.
AI API Observability Starts With Incident Questions
Before choosing fields, define the questions the incident commander must answer. For model routing, AI API observability should make these questions answerable from one request record or one correlated trace:
- Which application, environment, team, key, workflow, and customer-safe owner sent the request?
- Which endpoint family, requested model, route policy, and fallback rule applied at request time?
- Which provider, model, upstream account, or route actually served the response?
- Was the request retried, switched, throttled, queued, blocked, or aborted?
- Which status code, provider error class, rate-limit header, timeout, or stream event changed the outcome?
- How many input, output, cached, and reasoning tokens were counted, and what did the route cost?
- Did privacy controls store raw payloads, redacted payloads, metadata only, or no log entry?
If a log cannot answer those questions, the team will fill the gap with Slack memory, screenshots, and provider support tickets. That slows remediation and makes future route changes harder to trust.
The Model Routing Incident Log Checklist
The table below is the core AI API observability asset for this article. Use it as an implementation checklist for LLM API logs, gateway logs, or data warehouse events.
| Field Group | Fields To Capture | Why It Matters In A Routing Incident | Privacy Note |
|---|---|---|---|
| Correlation IDs | Application request ID, X-Client-Request-Id, provider x-request-id, W3C traceparent, gateway log ID, event ID. |
Connects the user-facing error, gateway decision, provider request, trace span, and support ticket. | Use opaque IDs. Do not encode email, IP, tenant name, or prompt text into trace fields. |
| Tenant and owner | Project, environment, API key ID or hash, team, workflow, customer-safe account ID, cost center. | Shows who was affected and who owns quota, cost, and remediation. | Prefer stable internal IDs over raw customer names or user emails. |
| Requested route | Endpoint family, requested model, provider preference, route policy, fallback policy, model alias version, catalog/pricing version. | Reconstructs what the client asked for and what the router was allowed to do at that moment. | Keep prompts out of the route object unless a separately approved debug mode is active. |
| Selected route | Final provider, final model, upstream account or channel, region if relevant, route decision reason, policy rule ID. | Proves whether the primary model served the response or a fallback path changed behavior or cost. | Account identifiers should be internal references, not provider secrets or full credentials. |
| Retry and fallback chain | Attempt index, retry count, prior provider/model, failure class, status code, fallback target, final outcome. | Prevents blind retries and shows whether the failover ladder behaved as designed. | Store error class and safe excerpts. Avoid storing full provider error bodies if they can echo prompt content. |
| Latency and streaming | Request start time, gateway duration, provider duration, time to first token/chunk, stream started, stream completed, abort reason, client disconnect. | Separates provider latency, gateway routing time, streaming stall, and client-side cancellation. | Streaming chunks are content. Log timing metadata by default and content only under a governed debug mode. |
| Usage and cost | Input tokens, output tokens, cached tokens, reasoning tokens, image/video units if relevant, request count, line item, estimated or final cost. | Explains budget impact when fallback shifts traffic to another provider, model, or service tier. | Aggregate by key, workflow, and team for normal dashboards; restrict per-user views. |
| Response shape | Finish reason, tool call IDs/names, output type, response status, truncation or incomplete details, service tier. | Shows whether the model stopped normally, called a tool, hit a limit, or returned an incomplete response. | Tool arguments and tool results can contain sensitive data. Store IDs and names by default. |
| Errors and rate limits | HTTP status, provider error code, timeout class, retry-after, remaining/limit/reset request headers, remaining/limit/reset token headers. | Distinguishes bad requests, auth failures, provider incidents, quota exhaustion, and rate-limit storms. | Normalize provider errors into safe classes before putting them in broad analytics tools. |
| Governance and retention | DLP action, policy ID, content logging mode, redaction flag, payload hash, retention class, deletion eligibility. | Lets security and compliance verify why content was stored, redacted, blocked, or excluded. | Default to metadata-only logs when raw content is not required for a defined support or audit workflow. |
Capture IDs Before You Debug The Provider
The first job of AI API observability is correlation. OpenAI's API reference recommends logging request IDs in production and documents both provider-generated x-request-id values and caller-supplied X-Client-Request-Id values. The latter matters when a timeout or network failure prevents your client from receiving the provider's response headers.
For a gateway, add one more layer: a gateway request ID that survives internal retry and fallback. If one user request tries provider A, then provider B, and finally a backup model, the gateway ID should bind all attempts together. The provider request ID should remain attempt-specific. The trace ID should bind this AI call to the rest of the application request.
W3C Trace Context defines traceparent and tracestate for propagating distributed trace context across services. Use those headers for trace correlation, not customer identity. The W3C privacy section is direct: tracing fields must not carry personally identifiable or otherwise sensitive information.
Log Requested Route And Selected Route Separately
A common mistake in AI gateway monitoring is logging only the final provider and model. That loses the most important routing evidence: what the client requested and what the policy allowed before the gateway made a decision.
Keep these two objects separate:
- Requested route: endpoint family, requested model or alias, route policy, provider preference, fallback policy, catalog version, pricing version, and request mode such as streaming or batch.
- Selected route: final provider, final model, upstream account or channel, region when relevant, route decision reason, and policy rule ID.
This split matters when a fallback response is valid but surprising. If the requested route was chat/completions with streaming enabled, and the selected route switched to another model after a timeout, the incident review can see both the intended path and the actual path. It also helps finance understand why usage appeared under a different model or line item.
Flatkey buyers should apply the same evaluation pattern. Start with the AI API gateway requirements checklist, then use the load balancing and failover playbook to define which route changes are allowed before you review the logs.
Record The Retry And Fallback Chain
Retries are where incomplete logs become expensive. If the only stored fields are final status and final model, the team cannot tell whether a request succeeded on the first attempt, after one retry, or after five attempts across providers. Incident-grade AI API observability treats retry and fallback as a chain.
Each attempt should include:
- Attempt index and parent gateway request ID.
- Provider, model, upstream account, and endpoint family for that attempt.
- Start time, duration, timeout class, and streaming state.
- Status code, provider error class, provider request ID, and rate-limit metadata.
- Fallback target and decision reason when the attempt does not end the chain.
This chain prevents the gateway from hiding real failure modes. A malformed request should fail closed, not cycle through providers. A provider 500 might justify one retry. A quota limit might switch to an approved upstream account. A customer-facing model mismatch might require a controlled error rather than silent fallback.
Measure Latency For Streams, Not Just Completed Calls
Streaming responses need more than total duration. Vercel's AI Gateway observability docs call out time to first token, request duration, token counts, and spend as gateway metrics. OpenTelemetry's GenAI semantic conventions include gen_ai.response.time_to_first_chunk and gen_ai.request.stream. Those fields are useful because many routing incidents are streaming incidents: the provider accepted the request, the first chunk was late, the stream stalled, or the client disconnected.
At minimum, log request start time, gateway duration, provider duration, time to first token or chunk, stream-started flag, stream-completed flag, abort reason, and client-disconnect state. For non-streaming responses, the same fields can remain null or false. This keeps one schema across Chat Completions, Responses, and provider-specific endpoint families.
Do not store stream chunks by default. Stream chunks are response content, and response content can include user data, retrieved context, tool results, or regulated information. For normal AI API observability, timing metadata is usually enough to diagnose a stall.
Connect Usage And Cost To The Route Decision
Usage and cost are incident fields, not just finance fields. OpenAI's Responses API examples include input, output, cached, reasoning, and total token usage. OpenAI's organization usage endpoint supports grouping by project, user, API key, model, batch, and service tier; the costs endpoint supports project, line item, and API key grouping. Vercel's AI Gateway docs similarly describe request summaries by project and API key, token counts, P75 duration, P75 TTFT, and cost.
For AI API observability, capture usage and cost at the attempt level when possible and at the final request level always. A fallback may be operationally correct and financially surprising. Without model, route, usage, and cost in the same event, finance may see a spend spike before engineering can explain it.
Flatkey's public pricing and homepage copy point to clear pricing, unified billing, usage analytics, and a dashboard for keys, usage, and routing. A June 18, 2026 pricing snapshot saved for this task returned 638 model rows, 23 vendors, and endpoint families including OpenAI Chat Completions, OpenAI Responses, Anthropic Messages, Gemini generateContent, image generation, and OpenAI video. Treat those counts as dated evidence, then verify the live pricing page and dashboard records for the specific models in your workflow.
Use Metadata-Only Logging As The Default
Raw prompts and responses are powerful debug tools, but they are also risky logs. Cloudflare's AI Gateway logging docs are a useful reference pattern: they describe request logs with prompt, response, provider, timestamp, status, token usage, cost, duration, and user agent, and they also document a header that can suppress raw request and response body storage while retaining metadata such as token counts, model, provider, status code, cost, and duration.
That is the right default posture for LLM API logs: collect metadata by default, then require an explicit debug mode or support workflow before raw content is stored. OpenTelemetry GenAI semantic conventions mark input messages, output messages, system instructions, tool call arguments, and tool call results as fields that can contain sensitive information. Your logging policy should reflect that.
A practical policy has four modes:
- No log: used for requests that must not be retained beyond transient processing.
- Metadata only: route, IDs, latency, status, usage, cost, and redaction flags.
- Redacted payload: selected request/response fields after PII and secret removal.
- Raw payload: short-lived, access-controlled debug capture for a specific incident or customer-approved support case.
A Sample Routing Log Event
This template is intentionally metadata-first. Adapt the names to your logging system, but keep the separation between requested route, selected route, attempts, usage, cost, and privacy controls.
{
  "gateway_request_id": "gw_01jz_route_abc",
  "app_request_id": "req_9a7c",
  "traceparent": "00-4bf92f3577b34da6a3ce929d0e0e4736-00f067aa0ba902b7-01",
  "client_request_id": "7c2c1b3a-4b55-4e36-bd47-8d1c2e2f2e11",
  "owner": {
    "project": "checkout-ai",
    "environment": "production",
    "api_key_id": "key_hash_6f12",
    "team": "platform",
    "workflow": "customer-chat"
  },
  "requested_route": {
    "endpoint_family": "chat_completions",
    "model": "primary-chat-model",
    "stream": true,
    "route_policy_id": "chat-prod-v8",
    "fallback_policy_id": "chat-prod-safe-fallback-v3",
    "catalog_version": "2026-06-18"
  },
  "selected_route": {
    "provider": "provider_b",
    "model": "backup-chat-model",
    "upstream_account": "acct_pool_2",
    "decision_reason": "primary_timeout",
    "policy_rule_id": "fallback_on_timeout_once"
  },
  "attempts": [
    {
      "index": 1,
      "provider": "provider_a",
      "model": "primary-chat-model",
      "provider_request_id": "req_provider_a_123",
      "status_code": 504,
      "error_class": "timeout",
      "duration_ms": 12000,
      "fallback_target": "provider_b"
    },
    {
      "index": 2,
      "provider": "provider_b",
      "model": "backup-chat-model",
      "provider_request_id": "req_provider_b_456",
      "status_code": 200,
      "duration_ms": 2400,
      "time_to_first_chunk_ms": 620,
      "finish_reason": "stop"
    }
  ],
  "usage": {
    "input_tokens": 1284,
    "output_tokens": 312,
    "cached_input_tokens": 0,
    "reasoning_output_tokens": 0
  },
  "cost": {
    "currency": "usd",
    "estimated_amount": 0.0048,
    "line_item": "backup-chat-model"
  },
  "privacy": {
    "content_logging_mode": "metadata_only",
    "payload_redacted": true,
    "retention_class": "30_day_incident_metadata"
  }
}
The field names are examples, not a Flatkey API contract. Use them to test whether your gateway, data warehouse, and incident tools can answer route questions without needing raw content.
A 10-Minute Triage Workflow
When a model routing incident starts, the AI API observability workflow should be short enough for the on-call engineer to run under pressure:
- Find the correlated request: search by app request ID, gateway request ID, user-facing error ID, provider request ID, or trace ID.
- Compare requested and selected routes: confirm the requested model, route policy, fallback rule, final provider, and final model.
- Read the attempt chain: identify the first failure, retry count, fallback target, and final outcome.
- Check rate-limit and quota context: inspect remaining, limit, and reset headers when providers return 429 or token pressure.
- Split latency from streaming: compare gateway duration, provider duration, time to first chunk, stream end, and client disconnect.
- Reconcile usage and cost: review token counts, service tier, cost line item, and team/key ownership.
- Review privacy mode: confirm whether the log is metadata-only, redacted, raw, or intentionally omitted.
- Decide the route action: rollback the policy, disable a route, lower traffic weight, raise quota, queue background work, or fail closed.
After the incident, turn the same steps into a dashboard view. The fastest reviews happen when engineering, support, and finance can inspect the same event shape.
How Flatkey Fits AI API Observability
Flatkey is positioned for teams that want one API key, one compatible router endpoint, clear pricing, unified billing, and one dashboard for keys, usage, and routing. For this article, the relevant proof path is practical: point a staging client at https://router.flatkey.ai/v1, send requests through a non-production key, trigger a controlled failure where possible, and confirm which usage, routing, error, and cost records appear in the dashboard.
Use per-key AI usage tracking to separate staging, production, customer, and workflow traffic. Use AI API quota management to keep fallback from burning shared budget. Use AI API cost attribution by team when routing changes need a finance owner.
The CTA is simple: if your team wants to test AI API observability behind one key, get a key, run a staging route through Flatkey, and review whether the logs answer the incident questions above before you rely on automatic switching in production.
FAQ
What is AI API observability?
AI API observability is the ability to inspect model API traffic across request IDs, traces, models, providers, route decisions, retries, fallback, usage, cost, latency, errors, and privacy controls. For routing incidents, it should explain both what the client requested and what the gateway actually selected.
What should LLM API logs capture?
LLM API logs should capture correlation IDs, owner metadata, requested route, selected route, retry chain, latency, streaming state, token usage, cost, finish reason, error class, rate-limit context, and content logging mode. Raw prompts and outputs should be optional, access-controlled, and redacted when possible.
Why log requested model and response model separately?
The requested model shows client intent. The response model shows what actually served the request. In a fallback incident, those can differ. Logging both is essential for quality review, cost reconciliation, and support communication.
How do request IDs help provider support?
Provider request IDs identify the upstream API call. A caller-supplied request ID can help when a timeout prevents the response header from reaching your client. Keep both IDs in the incident record, along with the gateway request ID and trace ID.
Should AI gateway monitoring store raw prompts?
Not by default. AI gateway monitoring usually needs metadata first: route, model, status, duration, usage, cost, and privacy mode. Store raw prompts or responses only under a defined debug, support, or audit workflow with retention and access controls.
Sources Used
- OpenAI API overview: debugging requests and request IDs
- OpenAI Chat Completions API reference and Responses API reference
- OpenAI organization usage and costs API reference
- Cloudflare AI Gateway logging docs
- Vercel AI Gateway observability docs
- W3C Trace Context recommendation
- OpenTelemetry GenAI semantic convention attributes
Final Check Before You Change Routing
Before you trust automatic fallback, make AI API observability part of the release gate. Confirm the route policy, retry ladder, token and cost fields, rate-limit headers, streaming timestamps, provider request IDs, privacy mode, and retention class. Then run a controlled staging incident and verify that the logs can explain the outcome without raw prompt access.
Flatkey reduces the integration surface to one key and one compatible base URL. To evaluate that reliability layer with your own traffic, get a key, run a staging workflow, and inspect the routing, usage, cost, and error records your team will need during a real incident.