AI Observability Implementation Checklist: 20 Production Steps
An AI observability implementation checklist should answer a harder question than “is the API up?” A production AI feature can return HTTP 200 while giving the wrong answer, using stale retrieval context, calling the wrong tool, retrying through an expensive fallback, leaking sensitive prompt data into logs, or taking too long to be useful.
The practical goal is to connect each user-visible outcome to the model attempts, retrieval steps, tool calls, policy decisions, latency, token usage, and cost that produced it. That requires conventional application telemetry plus AI-specific context and evaluation signals.
This guide provides a phased implementation plan for LLM applications, agents, retrieval-augmented generation systems, and multi-model gateways. It is vendor-neutral and uses OpenTelemetry concepts where possible. It also includes a signal-to-decision map, acceptance-test matrix, seven-day rollout plan, telemetry contract, instrumentation pattern, alert runbook, and vendor scorecard so a team can move from requirements to an operational launch.
AI Observability in One Sentence
AI observability is the ability to explain the behavior, quality, reliability, safety, and cost of an AI workflow from a correlated set of traces, metrics, logs, evaluations, and user outcomes.
Monitoring tells you that a threshold moved. Observability helps you determine why it moved and which requests, models, prompts, retrieval results, tools, tenants, or releases were involved.
Use the AI observability implementation checklist in this guide as a release gate, not as a one-time documentation exercise. Re-run it whenever you change a model, prompt, retrieval index, tool schema, routing policy, or evaluator.
For an AI application, one request may contain several distinct attempts:
user action
  └─ application workflow
      ├─ retrieval query
      ├─ model attempt 1
      ├─ tool call
      ├─ model attempt 2
      └─ validation and user-visible result
If these steps cannot be joined under one trace or request identity, debugging becomes guesswork.
The Minimum AI Observability Data Model
The data model is the foundation of the AI observability implementation checklist because every dashboard, alert, evaluation, and incident query depends on consistent correlation fields.
Start with one workflow-level trace and child spans for each material operation. OpenTelemetry defines traces, metrics, logs, and baggage as core signals. Its generative AI semantic conventions provide a developing vocabulary for model and agent operations and, as of August 4, 2026, are maintained in the dedicated OpenTelemetry semantic conventions repository. Because those conventions can evolve, pin the version you implement and keep a small internal compatibility layer rather than scattering vendor-specific field names throughout your code.
At minimum, capture these field groups.
| Field group | What to record | Why it matters |
|---|---|---|
| Correlation | trace_id, request_id, session ID, workflow, environment, release |
Joins the complete request path |
| Route | provider, requested model, resolved model, region, endpoint or route alias | Explains where the request actually ran |
| Attempt | attempt number, retry reason, fallback source and destination | Separates one user request from multiple billable calls |
| Performance | queue time, time to first token, total latency, tool and retrieval latency | Locates the slow stage |
| Usage | input, cached input, output, reasoning or provider-specific usage fields | Explains capacity and cost |
| Result | status, normalized error class, finish reason, validation result | Distinguishes transport success from task success |
| Quality | evaluator version, score, pass/fail, user feedback, accepted outcome | Tracks whether the response was useful |
| Governance | tenant, policy decision, redaction status, retention class | Supports privacy and audit controls |
Avoid treating the raw prompt and response as mandatory fields. In many systems, they should be disabled by default or stored only in a separately controlled evaluation dataset.
Map Every Signal to an Operational Decision
More telemetry is not automatically better. Before adding an attribute, metric, or dashboard, name the decision it supports and the person who owns that decision.
| Signal | Question it answers | Typical decision | Primary owner |
|---|---|---|---|
| Accepted completion rate | Did the workflow solve the customer task? | Roll back, change prompt/model, or investigate downstream failures | Product and AI engineering |
| p95 end-to-end latency | Is the complete experience fast enough? | Change route, reduce retrieval/tool latency, or adjust streaming | Platform engineering |
| Time to first token | Does streaming feel responsive? | Tune queueing, provider route, or prompt size | Platform engineering |
| Fallback rate | Is the primary route healthy and economical? | Investigate provider health, capacity, or route policy | Reliability engineering |
| Cost per accepted outcome | Are retries and low-quality results erasing savings? | Change model mix, caching, prompt size, or validation | Engineering and FinOps |
| Retrieval grounding pass rate | Did the answer use authorized, relevant context? | Rebuild index, filters, reranker, or citation validation | Search/RAG owner |
| Tool reconciliation failures | Did an external side effect complete safely? | Pause the tool, reconcile state, or repair idempotency | Application owner |
| Redaction failure count | Is sensitive data reaching the exporter? | Stop export, quarantine telemetry, or update policy | Security/privacy |
This table prevents the common failure mode where a dashboard contains dozens of charts but no one knows what action a change should trigger.
A Practical Trace Shape
Use one trace for the user-visible workflow, not one unrelated trace per provider call. The root should describe the customer task, while child spans describe the operations that contributed to the result.
workflow: answer_support_question
  attributes: tenant_class, release, accepted_outcome, final_status
  ├─ retrieval.search
  │    attributes: index_version, top_k, authorization_result
  ├─ gen_ai.attempt
  │    attributes: provider, requested_model, resolved_model, attempt=1
  ├─ tool.lookup_order
  │    attributes: tool_schema_version, idempotency_key, result
  ├─ gen_ai.attempt
  │    attributes: provider, resolved_model, attempt=2, fallback_reason
  └─ evaluation.validate_answer
       attributes: evaluator_version, pass, score_band
OpenTelemetry's generative AI semantic conventions are still evolving. Treat them as a shared vocabulary, but pin the convention version, record any local extensions, and test upgrades in staging. Keep business outcomes such as accepted_outcome in your own stable application namespace so a semantic-convention change does not break product reporting.
Phase 1: Define Outcomes Before Adding Dashboards
1. Name the workflow and accepted outcome
Do not begin with provider-wide token charts. Begin with a customer task such as:
- support answer accepted without escalation;
- code patch passes tests;
- extraction matches the required schema;
- agent completes the requested action without manual recovery;
- generated media passes the product review gate.
Create a machine-readable workflow name and an accepted_outcome or equivalent result. This becomes the denominator for quality, cost, and reliability metrics.
2. Define the failure taxonomy
Separate at least these classes:
- transport failure: timeout, connection error, or upstream 5xx;
- capacity failure: rate limit, quota, queue saturation, or context limit;
- contract failure: invalid JSON, missing field, unsupported tool schema, or broken stream;
- quality failure: answer is irrelevant, incorrect, incomplete, or not grounded;
- safety failure: policy violation, prompt injection success, or unsafe tool execution;
- business failure: technically valid output that the user rejects or abandons.
A single error=true dimension is not enough. It hides whether you need infrastructure work, a prompt change, a model change, or a product change.
3. Choose initial service-level indicators
Start with a small set that reflects the user experience:
workflow availability = accepted workflow completions / eligible workflow starts

quality pass rate = evaluator-passing completions / evaluated completions

p95 end-to-end latency = p95(workflow completed - workflow started)

cost per accepted outcome = total workflow cost / accepted outcomes
Keep provider availability as a diagnostic metric, not the product SLI. A provider can be healthy while your workflow fails because retrieval, tools, validation, or routing is broken.
Phase 2: Instrument the Complete Request Path
4. Create one root span per user-visible workflow
Generate the root trace at the application boundary, before retrieval or model routing starts. Propagate that context through queues, workers, gateways, tool services, and callbacks.
Use child spans for:
- retrieval and reranking;
- every model attempt;
- each tool call;
- guardrail or policy checks;
- output parsing and validation;
- fallback selection;
- persistence and downstream delivery.
5. Record the requested and resolved route
The model named by the client is not always the model that served the request. Record both:
{
  "ai.requested_model": "support-balanced",
  "ai.resolved_provider": "provider-b",
  "ai.resolved_model": "model-version-2026-07",
  "ai.route_reason": "primary_rate_limited",
  "ai.attempt": 2
}
This is essential for multi-provider systems. It also makes a model fallback strategy auditable instead of invisible.
6. Measure streaming separately
Total latency alone does not describe a streaming experience. Capture:
- queue duration;
- connection and provider latency;
- time to first token or first useful event;
- generation duration;
- end-to-end completion time;
- client cancellation time.
A request can have acceptable total latency but poor time to first token. It can also produce the first token quickly and then stall.
7. Make retries and fallbacks first-class attempts
Never overwrite the first failed attempt with the final success. One workflow span should contain or link to every billable attempt, including:
- retry number;
- trigger;
- backoff duration;
- provider and model;
- tokens and cost;
- partial output status;
- final disposition.
This prevents a retry storm from appearing as “100% success.”
Phase 3: Add AI-Specific Quality Context
8. Version prompts, tools, policies, and evaluators
Store stable identifiers rather than only raw content:
prompt_version
tool_schema_version
retrieval_index_version
policy_version
evaluator_version
route_policy_version
These dimensions let you compare a release before and after a change. Without versioning, a quality drop becomes difficult to attribute.
9. Trace retrieval quality
For retrieval-augmented generation, record:
- query version and filters;
- retrieval latency;
- document or chunk IDs;
- source freshness;
- top-k and reranker version;
- empty-result rate;
- access-control decision;
- citation or grounding validation result.
Do not place full private documents in general-purpose trace storage. Store controlled references or hashes unless the debugging policy explicitly permits content capture.
10. Trace tool calls and side effects
Each tool span should include the tool name, schema version, authorization decision, latency, normalized result, and whether it produced an external side effect.
For side-effecting tools, also record an idempotency key and reconciliation state. This matters when a model call times out after the tool has already completed.
11. Join online and offline evaluations
Online signals are fast but noisy: thumbs-up, abandonment, regeneration, correction, escalation, or task completion. Offline evaluations are slower but controlled: curated test sets, rubric graders, executable tests, and human review.
Connect both to the same workflow and version identifiers. Do not mix scores from different evaluator versions into one trend line without labeling the change.
Phase 4: Control Privacy, Security, and Retention
12. Classify telemetry before collection
Define three levels:
- Metadata: route, timing, tokens, status, versions, and IDs.
- Derived content signals: length, language, safety category, evaluator score, or hash.
- Raw content: prompts, responses, retrieved text, tool arguments, and tool results.
Collect metadata broadly. Collect raw content only when the use case, user notice, access control, and retention policy support it.
13. Redact at the collection boundary
Redaction should happen before export whenever possible. Cover:
- API keys, bearer tokens, cookies, and authorization headers;
- email addresses, phone numbers, account numbers, and government identifiers;
- secrets inside tool arguments or retrieved documents;
- signed URLs and database connection strings;
- tenant-specific content prohibited from shared observability stores.
Use allowlists for exported attributes. A denylist will eventually miss a new secret-bearing field. Apply the same discipline described in this AI API key management guide.
14. Set retention and access by data class
Raw content should not inherit the same retention as low-risk metrics. Define separate storage, encryption, access roles, audit logs, and deletion processes. Test deletion rather than assuming a policy document is enough.
The NIST AI Risk Management Framework and its Generative AI Profile emphasize ongoing measurement, documentation, and risk management across the system lifecycle. Observability helps provide evidence, but indiscriminate logging can create a new privacy and security risk.
15. Control high-cardinality dimensions
Do not turn user IDs, trace IDs, prompt text, document IDs, or raw error messages into metric labels. Keep high-cardinality data in traces or logs, then derive bounded metrics such as workflow, model family, error class, environment, and region.
Phase 5: Build Alerts That Point to Action
16. Alert on user-impacting symptoms
Page on symptoms such as:
- accepted completion rate below the objective;
- quality pass rate dropping beyond the release guardrail;
- p95 latency or time to first token consuming the error budget;
- cost per accepted outcome exceeding its limit;
- unsafe side-effect or policy failure;
- fallback rate rising above its normal band.
Use provider errors, token spikes, and retrieval misses as diagnostic alerts or dashboard signals unless they directly threaten the user-facing objective.
17. Use burn-rate windows for SLO alerts
A static threshold can be noisy. Error-budget burn-rate alerting asks how quickly the service is consuming the allowed failure budget. Google’s SRE guidance recommends combining a faster window with a slower confirmation window so severe incidents page quickly without making every brief spike actionable.
18. Add release and route annotations
Every dashboard should show prompt, application, routing, model, and evaluator releases. Add deployment annotations and compare canary versus control cohorts. Otherwise the team will see a line move without seeing what changed.
Phase 6: Validate Before Full Rollout
19. Run failure drills
Test at least:
- upstream timeout;
- rate limit and quota exhaustion;
- malformed structured output;
- partial streaming interruption;
- retrieval returns no authorized context;
- tool succeeds but response is lost;
- fallback changes model behavior;
- telemetry exporter is unavailable;
- redaction rule receives an unknown field.
Confirm that the workflow fails safely, the trace remains coherent, and the alert identifies the right owner.
20. Roll out in four stages
- Shadow: emit telemetry without changing routing or user behavior.
- Canary: enable for a small traffic slice and compare overhead, cardinality, and data quality.
- Guarded production: attach release thresholds and rollback rules.
- Full production: expand after privacy, reliability, and cost checks pass.
OpenTelemetry supports head and tail sampling patterns. Preserve all errors and rare failure classes where feasible, then sample routine success traffic to control cost. Sampling rules must not remove the exact traces needed to explain an incident.
Production Acceptance-Test Matrix
Acceptance tests prove that the AI observability implementation checklist works under failure, privacy, and telemetry-loss scenarios rather than only on successful requests.
Do not declare observability complete because spans appear in a trace viewer. Run controlled tests and save evidence for each release gate.
| Test | Injected condition | Required telemetry evidence | Pass condition |
|---|---|---|---|
| Upstream timeout | Force the primary model route to exceed its deadline | First attempt span, timeout class, retry or fallback decision, final outcome | No orphan spans; final disposition and total cost are visible |
| Rate limit | Return a provider 429 or exhaust a test quota | Raw provider code, normalized capacity class, backoff duration, route change | Retry budget is bounded and the alert points to the route owner |
| Invalid structured output | Return malformed JSON or a missing required field | Contract-validation span, validator version, repair attempt, final pass/fail | HTTP success is not counted as accepted success |
| Broken stream | Interrupt output after the first token | Time to first token, partial-output flag, billable usage, retry decision | Duplicate content and double tool execution are prevented |
| Empty retrieval | Return no authorized documents | Retrieval filters, authorization result, empty-result reason, answer policy | The system follows the approved no-context behavior |
| Tool ambiguity | Let a tool finish while the model request times out | Idempotency key, side-effect state, reconciliation result | The tool is not executed twice and state is recoverable |
| Redaction canary | Insert a synthetic secret into a test field | Local detection event without exported secret value | Export is blocked or redacted before leaving the boundary |
| Exporter outage | Stop the telemetry destination | Exporter queue/drop metrics and application health | User traffic stays within its reliability budget |
| Sampling check | Generate rare errors amid high success traffic | Error traces retained; routine successes sampled as configured | Incident examples remain searchable after sampling |
| Release regression | Deploy a canary with known latency or quality degradation | Release annotation, canary cohort, control cohort, SLI comparison | Rollback threshold fires with an identifiable change owner |
For every test, record the owner, test date, trace ID, expected alert, observed alert, and remediation ticket. This turns observability into a repeatable release control instead of a one-time instrumentation project.
Seven-Day Implementation Plan
For a focused team, the AI observability implementation checklist can be implemented as a seven-day sequence that leaves each day with reviewable evidence.
This sequence is intentionally narrow. It delivers a trustworthy vertical slice before the team expands coverage.
- Day 1 — Outcome contract: choose one high-value workflow, define eligible starts, accepted outcomes, failure classes, and SLI formulas.
- Day 2 — Trace skeleton: create the root workflow span and propagate context through the application, queue, gateway, retrieval layer, and tools.
- Day 3 — Model attempts: capture requested and resolved routes, attempts, latency, finish reason, provider usage, retries, and fallbacks.
- Day 4 — Quality and cost: join validator results, evaluator versions, user outcomes, and normalized workflow cost.
- Day 5 — Privacy controls: classify fields, implement allowlist export, test redaction, set retention, and verify access boundaries.
- Day 6 — SLOs and dashboards: build the minimum dashboard, add release annotations, define burn-rate alerts, and assign owners.
- Day 7 — Failure drills: run the acceptance matrix, fix gaps, begin a canary, and document rollback conditions.
At the end of day seven, the goal is not universal instrumentation. The goal is one production workflow whose behavior, quality, reliability, safety, and cost can be explained from start to finish.
Minimum Dashboard for Launch
The dashboard is the operational view of the AI observability implementation checklist. It should expose customer outcomes first and infrastructure details second.
Keep the first operational view small enough to use during an incident:
- Outcome row: eligible starts, accepted completions, quality pass rate, and abandonment or escalation.
- Reliability row: normalized errors, fallback rate, retry amplification, and error-budget burn.
- Latency row: end-to-end p50/p95/p99, queue time, time to first token, retrieval latency, and tool latency.
- Economics row: input/output/cached tokens, total workflow cost, and cost per accepted outcome.
- Change row: application, prompt, route policy, model, retrieval index, tool schema, and evaluator releases.
- Investigation links: representative traces for each failure class, release, route, and affected workflow.
The dashboard should support a path from symptom to trace. If an alert shows a quality drop but the team cannot reach affected workflow traces in a few clicks, the investigation loop is incomplete.
AI Observability Platform Evaluation Scorecard
Commercial evaluation should test whether a platform supports your operating model, not whether it has the longest feature list. Score candidates against the same instrumented pilot workload.
| Criterion | Weight | What to verify in a pilot |
|---|---|---|
| Workflow correlation | 20% | One trace joins model attempts, retrieval, tools, validation, and user outcome |
| OpenTelemetry interoperability | 15% | Standard export/import works; local extensions remain queryable; data is portable |
| Quality and evaluation joins | 15% | Online feedback and versioned offline evaluations connect to production traces |
| Privacy and governance | 15% | Field allowlists, redaction, regional controls, access roles, audit logs, and deletion tests |
| Reliability operations | 15% | SLOs, burn-rate alerts, sampling controls, release annotations, and incident drill support |
| Cost attribution | 10% | Provider usage, retries, fallbacks, cached tokens, and cost per accepted outcome reconcile |
| Agent/RAG/tool coverage | 5% | Retrieval and side-effecting tool operations have first-class spans and filters |
| Operational cost | 5% | Ingestion, storage, query, retention, and engineering overhead fit the expected volume |
Use a 1–5 score for each criterion, multiply by the weight, and require written evidence from the pilot. A platform that cannot preserve your telemetry contract or export your data creates operational lock-in even if its dashboards look polished.
Copyable Telemetry Contract
The fastest way to make an AI observability implementation checklist operational is to turn it into a versioned telemetry contract. The contract defines what every workflow and model attempt must emit, which fields are optional, which values are allowed, and which fields are prohibited from high-volume indexes.
The example below uses an internal namespace. Map it to the pinned OpenTelemetry GenAI conventions inside one adapter rather than exposing application code to convention changes.
telemetry_contract:
  version: "2026-08-04"
  workflow_span:
    required:
      - ai.workflow.name
      - ai.workflow.version
      - ai.request.id
      - deployment.environment
      - service.version
      - ai.outcome.status
      - ai.outcome.accepted
      - ai.latency.total_ms
    optional:
      - ai.tenant.tier
      - ai.experiment.id
      - ai.user.feedback
    prohibited:
      - end_user.email
      - end_user.name
      - raw.authorization_header

  model_attempt_span:
    required:
      - ai.attempt.number
      - ai.route.requested_model
      - ai.route.resolved_provider
      - ai.route.resolved_model
      - ai.result.status
      - ai.usage.input_tokens
      - ai.usage.output_tokens
      - ai.latency.first_token_ms
      - ai.latency.total_ms
    conditional:
      - ai.fallback.reason
      - ai.error.class
      - ai.error.provider_code
      - ai.usage.cached_input_tokens

  content_capture:
    default: "off"
    allowed_when:
      - approved_evaluation_dataset
      - explicit_debug_session
    controls:
      - redact_before_export
      - access_logged
      - retention_approved
Review this contract in code review just like an API schema. A new model provider, agent tool, fallback policy, or evaluator should not ship until its telemetry fields map to the contract and pass the same acceptance tests.
Instrumentation Pattern for One AI Workflow
Do not let every team invent span names and attributes independently. Provide a small wrapper that creates the root workflow span, records child attempts, captures normalized outcomes, and applies redaction before export.
This Python example is intentionally provider-neutral. The internal attribute names should be translated to your pinned OpenTelemetry semantic convention version in the wrapper or collector layer.
from opentelemetry import trace

tracer = trace.get_tracer("checkout-assistant")


def run_ai_workflow(request, router, evaluator):
    with tracer.start_as_current_span("ai.workflow.checkout_help") as workflow_span:
        workflow_span.set_attribute("ai.workflow.name", "checkout_help")
        workflow_span.set_attribute("ai.workflow.version", "2026-08-04")
        workflow_span.set_attribute("ai.request.id", request.request_id)

        result = None
        for attempt_number in range(1, 3):
            with tracer.start_as_current_span("ai.model.attempt") as attempt_span:
                route = router.resolve(request, attempt_number)
                attempt_span.set_attribute("ai.attempt.number", attempt_number)
                attempt_span.set_attribute("ai.route.requested_model", request.model)
                attempt_span.set_attribute("ai.route.resolved_provider", route.provider)
                attempt_span.set_attribute("ai.route.resolved_model", route.model)

                result = route.generate(request)
                attempt_span.set_attribute("ai.result.status", result.status)
                attempt_span.set_attribute("ai.usage.input_tokens", result.input_tokens)
                attempt_span.set_attribute("ai.usage.output_tokens", result.output_tokens)

                if result.status == "ok":
                    break

                attempt_span.set_attribute("ai.error.class", result.error_class)

        evaluation = evaluator.score(request, result)
        workflow_span.set_attribute("ai.outcome.status", result.status)
        workflow_span.set_attribute("ai.outcome.accepted", evaluation.accepted)
        workflow_span.set_attribute("ai.evaluator.version", evaluation.version)
        workflow_span.set_attribute("ai.quality.score", evaluation.score)
        return result
Production code should also record duration, time to first token, fallback reasons, cancellation, streaming errors, and exceptions. The important design choice is the hierarchy: one customer workflow contains one or more billable attempts, and the workflow records the final accepted outcome.
Alert Policy and First-Response Runbook
An AI observability implementation checklist is incomplete if dashboards have no response rules. Each launch metric needs a trigger, an owner, and a first diagnostic query.
| Alert | Example trigger | First question | Immediate action |
|---|---|---|---|
| Accepted-outcome burn | Fast and slow error-budget burn | Which workflow, release, route, or tenant changed? | Pause rollout or revert the implicated release |
| Latency regression | p95 workflow latency breaches the SLO | Did queue, retrieval, model, or tool latency move? | Route around the slow stage or reduce load |
| Fallback surge | Fallback rate exceeds its normal band | Is the primary provider failing, throttling, or timing out? | Inspect normalized and raw provider errors |
| Cost-per-outcome spike | Cost rises while acceptance stays flat or falls | Are retries, output length, or expensive routes increasing? | Cap retries and restore the prior route policy |
| Quality-score drop | Online or sampled evaluator pass rate falls | Did prompt, retrieval, model, or evaluator version change? | Compare the release cohort with the last healthy cohort |
| Tool uncertainty | Side-effect result cannot be reconciled | Did the tool finish before timeout or cancellation? | Stop automatic retry and enter reconciliation |
| Telemetry loss | Expected span or usage completeness drops | Is instrumentation broken or export backpressure rising? | Treat missing telemetry as an operational incident |
The on-call view should link directly from an alert to traces filtered by workflow, release, requested model, resolved route, and error class. If responders must manually reconstruct those filters during an incident, the system is not launch-ready.
Ownership and Production Handoff
Assign the checklist to named roles before rollout. Shared ownership without an explicit decision maker usually produces dashboards that everyone can view and nobody maintains.
| Responsibility | Accountable role | Required handoff evidence |
|---|---|---|
| Workflow outcome definition | Product or AI feature owner | Accepted-outcome rule and rejection examples |
| Span and metric schema | Platform or observability owner | Versioned telemetry contract and schema tests |
| Route and fallback fields | Gateway or reliability owner | Requested/resolved route and attempt validation |
| Quality evaluators | AI engineering owner | Evaluator version, dataset, thresholds, known limits |
| Privacy and retention | Security or privacy owner | Data classification, redaction test, retention approval |
| SLOs and alerts | Service owner | SLO document, paging rules, dashboard, runbook |
| Cost allocation | Engineering finance owner | Usage completeness and cost-per-outcome reconciliation |
| Release readiness | Engineering lead | Completed acceptance matrix and rollback trigger |
Schedule a 30-day review after launch. Remove unused fields, promote repeatedly useful debug queries into dashboard views, review cardinality and storage cost, and update the contract when workflow behavior changes.
Copyable AI Observability Implementation Checklist
Use this list as a launch gate:
- [ ] Define each workflow and accepted customer outcome.
- [ ] Define transport, capacity, contract, quality, safety, and business failures.
- [ ] Select availability, quality, latency, and cost-per-outcome SLIs.
- [ ] Approve a versioned telemetry contract with required, optional, and prohibited fields.
- [ ] Create one root trace per user-visible workflow.
- [ ] Propagate context through queues, tools, retrieval, and gateways.
- [ ] Record requested and resolved provider/model routes.
- [ ] Create a separate span for every retry and fallback attempt.
- [ ] Capture queue time, time to first token, and total latency.
- [ ] Capture provider-reported token usage and normalized cost.
- [ ] Version prompts, tools, retrieval indexes, policies, routes, and evaluators.
- [ ] Record retrieval references, freshness, authorization, and grounding results.
- [ ] Record tool authorization, idempotency, result, and side-effect state.
- [ ] Join user feedback and offline evaluation results to traces.
- [ ] Classify telemetry as metadata, derived signals, or raw content.
- [ ] Redact secrets and sensitive fields before export.
- [ ] Apply separate retention and access policies by data class.
- [ ] Keep high-cardinality values out of metric labels.
- [ ] Alert on user-impacting SLOs and error-budget burn.
- [ ] Annotate releases and compare canary versus control.
- [ ] Run failure, privacy, sampling, and exporter-outage drills.
- [ ] Save acceptance-test evidence and trace IDs for the release gate.
- [ ] Compare observability platforms with one weighted pilot scorecard.
- [ ] Assign accountable owners for outcomes, schema, privacy, SLOs, quality, and cost.
- [ ] Link every page-worthy alert to a first-response runbook and trace query.
Common AI Observability Mistakes
Logging prompts without a data policy
Raw prompts feel useful during debugging, but they can contain customer data, secrets, copyrighted material, or regulated information. Start with metadata and enable controlled content capture only where justified.
Measuring cost per request instead of cost per result
A cheap request that fails validation is not cheap. Retries, fallbacks, and human correction belong in the workflow cost. The same principle applies to prompt caching ROI: optimize the accepted task, not an isolated token rate.
Treating every model call as independent
Agents and RAG systems are workflows. If model, retrieval, and tool spans are not correlated, the team cannot reconstruct causality.
Depending on one provider dashboard
Provider dashboards are useful for upstream usage and errors, but they do not see your complete application outcome, retrieval system, tool execution, user feedback, or cross-provider fallback path.
Instrumenting everything before defining decisions
Telemetry has operational cost. Every field should support a debugging, alerting, evaluation, governance, or optimization decision. Remove fields nobody uses.
Where an AI Gateway Fits
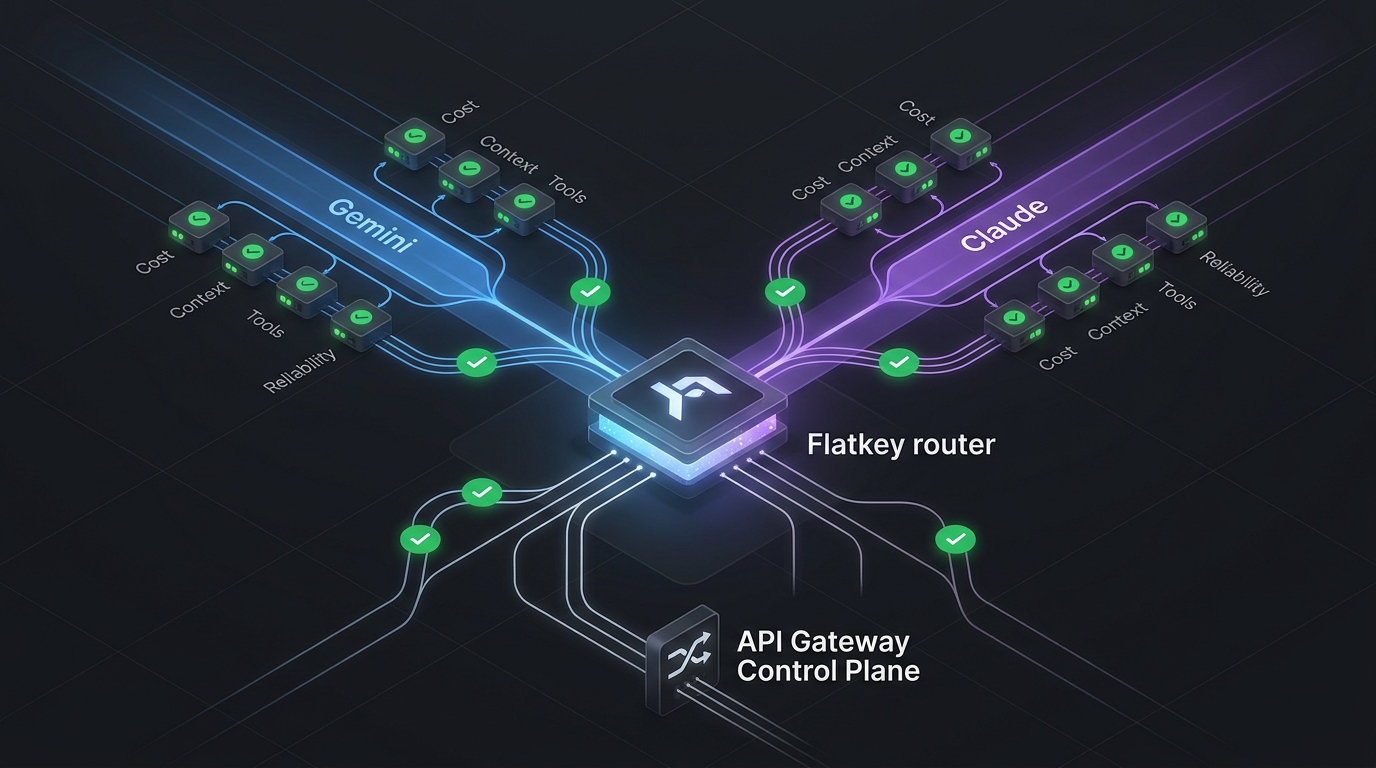
An LLM gateway can be a useful correlation and policy boundary because multiple applications and providers pass through one control point. It can normalize route, attempt, usage, latency, and error metadata before exporting telemetry to your observability stack.
The gateway is not the whole solution. Application code still owns workflow outcomes, retrieval context, tool semantics, user feedback, and business conversion. The strongest design joins gateway telemetry with those application-level signals.
Flatkey provides one OpenAI-compatible access layer for multiple AI models. If your team is consolidating provider integrations, explore Flatkey and use this checklist to define the telemetry contract around your application and routing layer.
Frequently Asked Questions
What should I implement first for AI observability?
Start the AI observability implementation checklist with one root trace per customer workflow, model-attempt child spans, requested and resolved model fields, latency, usage, normalized errors, and an accepted-outcome signal. Add raw prompt capture later, if your privacy policy permits it.
Is OpenTelemetry enough for LLM observability?
OpenTelemetry provides the transport-neutral foundation for traces, metrics, and logs, plus evolving generative AI semantic conventions. You still need workflow definitions, evaluations, privacy controls, SLOs, dashboards, and incident processes.
Should prompts and responses be stored in traces?
Not by default. Use metadata, versions, hashes, and derived quality signals first. Store raw content only in controlled systems with an explicit purpose, access policy, retention period, and deletion process.
Which AI observability metrics matter most?
Start with accepted completion rate, quality pass rate, p95 end-to-end latency, time to first token for streaming, fallback rate, and cost per accepted outcome. Add workflow-specific metrics after these are trustworthy.
How do I monitor multiple AI providers?
Use one stable telemetry schema across providers. Record both the requested route and resolved provider/model on each attempt, normalize errors without discarding the raw provider code, and join all attempts under the same workflow trace.