A token usage dashboard AI API teams can trust is not just a token chart. It is the shared operating record that lets engineering debug model behavior, platform teams control quotas, and finance explain why the bill changed.
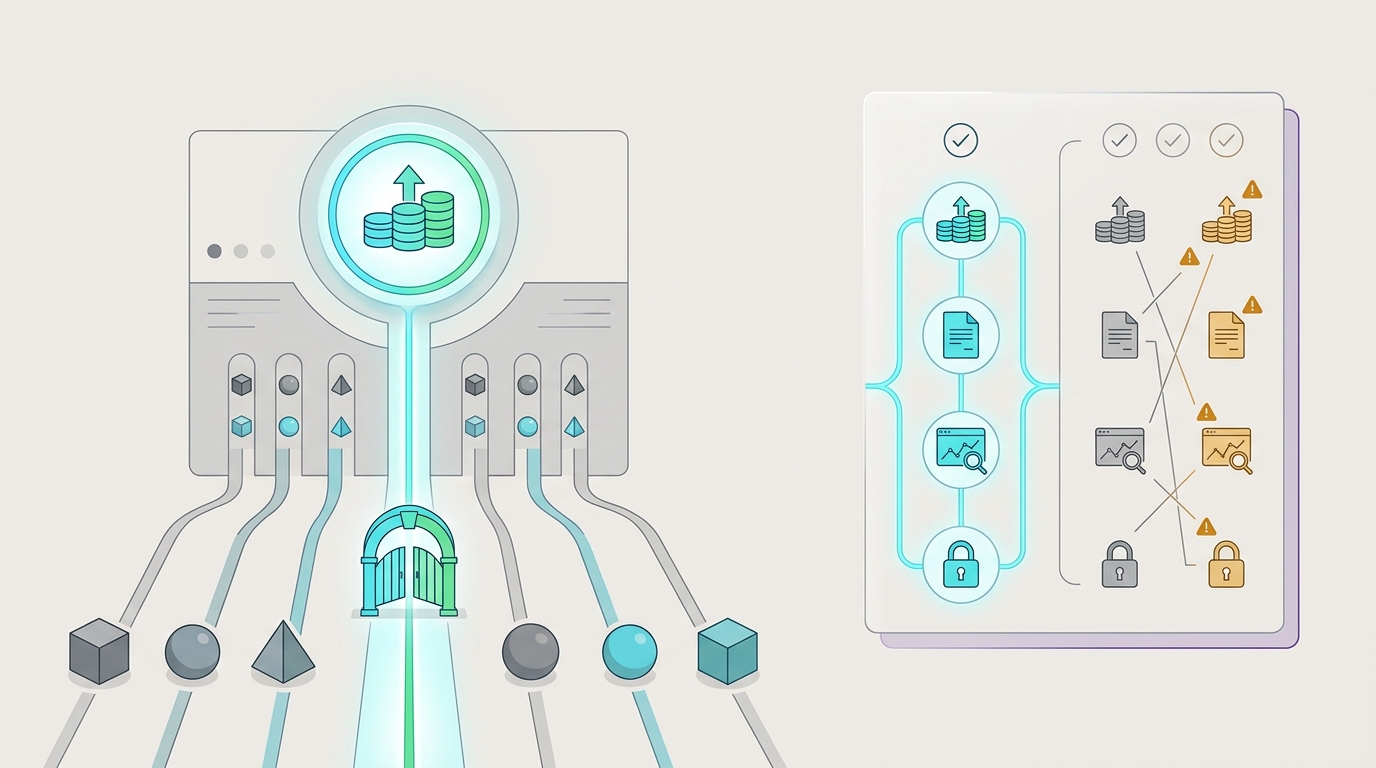
The hard part is that engineering and finance need different answers from the same traffic. Engineering asks which request, model, key, route, status, retry, latency, and token split caused the event. Finance asks which owner, cost center, quota window, pricing unit, recharge record, and approval state should absorb the cost. A useful token usage dashboard AI API connects both views without forcing either team to rebuild context in a spreadsheet.
This guide was checked on June 26, 2026 Asia/Shanghai against the official OpenAI organization usage and cost API schema, the OpenAI usage and cost API cookbook, Cloudflare AI Gateway logging and custom metadata docs, Vercel AI Gateway observability docs, and current Flatkey public homepage and pricing snapshots. Treat provider fields, catalog counts, dashboard labels, and pricing units as point-in-time evidence. Verify current rows in Flatkey pricing before making production budget decisions.
Quick Answer: What A Token Usage Dashboard AI API Should Show
A token usage dashboard AI API should show enough fields to answer four questions in one place:
- What happened? Request ID, timestamp, status, route, model, endpoint family, token split, latency, retry count, fallback path, and error class.
- Who owns it? API key, project, user or service account, team, environment, workflow, customer or workspace, and cost center.
- What did it cost? Input tokens, output tokens, cached input tokens, request count, media units where relevant, line item, amount, currency, pricing version, and quota window.
- What should happen next? Alert threshold, quota state, recharge or invoice record, approval owner, review note, and exception status.
| Dashboard Area | Engineering Needs | Finance Needs | Minimum Fields |
|---|---|---|---|
| Request identity | Trace a bad response, slow stream, retry loop, or failed fallback | Audit which usage record maps to which billing line | Request ID, timestamp, API key ID, project ID, user or service account, environment |
| Model and route | Compare provider, model, endpoint family, service tier, and fallback behavior | Explain why the unit price or line item changed | Provider, model, endpoint family, route group, service tier, batch flag, fallback route |
| Usage units | Debug long prompts, large outputs, cache misses, audio usage, image or video units | Normalize units before showback or chargeback | Input tokens, output tokens, cached input tokens, audio tokens, request count, media unit |
| Cost and owner | See the cost impact of request design and retries | Assign spend to the correct budget owner | Amount, currency, line item, team, cost center, customer or workspace, pricing snapshot |
| Control state | Know whether a spike should alert, block, reroute, or downgrade | Approve quota increases and prepaid recharge decisions | Quota window, current usage, soft limit, hard limit, recharge record, approval status |
If your dashboard cannot connect those fields, the token usage dashboard AI API becomes a chart for one team and a reconciliation problem for another.
Why Engineering And Finance Need The Same Record
Engineering usually starts from the request path. A model got slower, a response quality dropped, an evaluation run consumed more tokens, or a fallback route ran more often than expected. The natural fields are technical: model, endpoint, prompt size, completion size, cache status, status code, retry count, latency, and error class.
Finance starts from the bill. The natural fields are owner, project, cost center, line item, currency, invoice period, budget, quota, recharge, and approval history. Finance does not need every debugging detail, but it does need a clean bridge from spend to accountable owner.
The token usage dashboard AI API sits between those workflows. It should let an engineer click from a monthly spike to the exact model and retry pattern. It should let finance roll the same records into showback or chargeback without asking engineering to annotate every invoice after the month closes.
For adjacent setup work, use per-key AI usage tracking to scope traffic ownership, AI API cost attribution by team to map spend to budget owners, and AI API quota management to keep the dashboard tied to real limits.
Token Usage Dashboard AI API Field Dictionary
Use this field dictionary as the value asset for a token usage dashboard AI API rollout. The exact names can vary across providers and gateways, but the concepts should be present before finance relies on the dashboard.
| Field Group | Fields To Capture | Primary User | Review Purpose |
|---|---|---|---|
| Time bucket | Start time, end time, bucket width, timezone, ingestion time | Both | Compare hourly incidents with daily billing and monthly review windows |
| Request identity | Request ID, trace ID, gateway log ID, batch job ID, pagination cursor when exported | Engineering | Find the exact record behind a spike, error, or finance exception |
| Ownership | Project ID, API key ID, user ID, service account, team, cost center, budget owner | Finance | Assign cost and usage to the accountable owner |
| Environment and workflow | Development, staging, production, evaluation, batch, support agent, customer workspace | Both | Separate test traffic, production traffic, customer traffic, and internal automation |
| Model and endpoint | Provider, model ID, endpoint family, modality, service tier, route group, final route | Engineering | Explain behavior, unit pricing, and model mix changes |
| Token metrics | Input tokens, output tokens, cached input tokens, reasoning or audio tokens where exposed | Both | Show whether cost came from prompt size, output size, cache misses, or modality-specific usage |
| Request metrics | Number of model requests, accepted output count, retries, fallback attempts, batch flag | Engineering | Separate healthy traffic growth from repeated failed work |
| Reliability | Status, status code, error class, latency, time to first token, duration, timeout reason | Engineering | Connect cost changes to incidents, slow routes, and retry policy |
| Cost | Amount, currency, line item, pricing unit, quantity, pricing snapshot date, invoice period | Finance | Reconcile usage to the bill and normalize token, image, video, and batch units |
| Quota and budget | Soft limit, hard limit, reset window, usage percent, quota event, alert recipient | Both | Decide whether to alert, block, downgrade, reroute, or approve more spend |
| Recharge and approval | Recharge ID, invoice ID, approval ticket, approver, review state, exception note | Finance | Make monthly budget decisions auditable |
| Privacy and retention | Payload logging setting, metadata-only flag, retention class, redaction status | Security and finance | Keep cost visibility without storing unnecessary prompts, outputs, or sensitive content |
OpenAI's organization usage endpoint supports filters such as project, user, API key, model, and batch, and grouping by project, user, API key, model, batch, and service tier. Its costs endpoint separates amount, currency, line item, project, API key, and quantity concepts. Those provider fields are a useful baseline for a token usage dashboard AI API, but they are not the whole operating model. Teams still need owner tags, quota windows, recharge records, review notes, and gateway route context.
Engineering View: Fields For Debugging Spend
Engineering needs the dashboard to explain why usage changed. A request count alone is weak. A token total is better, but still incomplete. The useful engineering view is a request sequence:
- Route selected: Which provider, model, endpoint family, and service tier handled the request?
- Payload shape: How many input, output, cached, audio, image, or video units were involved?
- Control behavior: Was the request batch, streaming, retried, throttled, blocked, downgraded, or sent through a fallback?
- Reliability: What was the final status, latency, time to first token, error class, and duration?
- Cost effect: How much did the request, retry set, or accepted output cost?
That sequence matters because a token usage dashboard AI API should distinguish planned growth from waste. If input tokens rise because a feature added retrieved context, that is a product decision. If output tokens rise because a prompt stopped respecting length limits, that is an engineering fix. If cost rises because retries multiplied failed requests, that is reliability work. If cost rises because traffic moved to a different model or service tier, that is a routing decision.
Finance View: Fields For Reviewing Cost
Finance needs the same data to roll up cleanly. The useful finance view starts with the owner and ends with an approval decision:
| Finance Question | Dashboard Fields | Decision It Supports |
|---|---|---|
| Which team owns this spend? | Team, cost center, project, API key ID, workflow, customer or workspace | Showback, chargeback, or budget owner review |
| Is the spend expected? | Quota window, baseline usage, alert threshold, approval ticket, launch date | Approve growth, investigate variance, or freeze quota increases |
| Which unit caused the change? | Input tokens, output tokens, cached input tokens, media units, line item, quantity | Normalize text, image, video, batch, and fallback spend |
| Can the bill be reconciled? | Amount, currency, invoice period, pricing version, line item, recharge record | Match dashboard totals to invoice or prepaid balance movement |
| What changes next month? | Exception notes, quota changes, owner approval, model or route change, renewal context | Budget adjustment, procurement review, or usage policy update |
If finance cannot see these fields, a token usage dashboard AI API still leaves the month-end review dependent on engineering interpretation. If engineering cannot see the request and route details, finance may approve a quota increase for spend that actually came from retries, cache misses, or test traffic.
Request Record Template
A practical token usage dashboard AI API can start with one normalized record per request, then roll up into buckets for daily and monthly review. This template is intentionally provider-neutral:
| Record Field | Example | Why It Belongs In The Dashboard |
|---|---|---|
| request_id | Internal trace or gateway log ID | Lets engineering and finance point to the same event |
| timestamp and bucket | 2026-06-26T10:00+08:00, 1h bucket | Supports incident review and billing rollups |
| owner_context | team, cost center, project, API key, workflow, environment | Assigns accountability before the invoice arrives |
| route_context | provider, model, endpoint family, service tier, fallback route | Explains behavior and pricing-unit differences |
| usage_context | input tokens, output tokens, cached tokens, request count, media unit | Shows the unit that produced cost |
| reliability_context | status, error class, latency, retry count, fallback attempts | Separates expected usage from failure-driven spend |
| cost_context | amount, currency, line item, pricing version, invoice period | Feeds finance reconciliation and showback |
| control_context | quota state, alert threshold, recharge ID, approval state | Turns reporting into an operating decision |
For privacy, do not make raw prompts or outputs required fields for cost review. Cloudflare's logging docs show a useful pattern: teams can retain metadata such as token counts, model, provider, status code, cost, and duration while controlling whether raw payloads are stored. Whether you use Cloudflare, Vercel, Flatkey, or a custom gateway, the principle is the same: cost review needs operational metadata, not unnecessary sensitive content.
Quota And Recharge Workflow
A token usage dashboard AI API should not stop at reporting. It should drive the quota and budget workflow.
- Set the owner: every high-volume key, route, workflow, or customer segment needs one accountable owner.
- Set the expected unit: tokens, cached tokens, audio tokens, images, video seconds, requests, or provider-specific quantity.
- Set the reset window: hourly incident view, daily budget guardrail, monthly finance review, or prepaid balance period.
- Set thresholds: soft alert, hard cap, auto-downgrade, route pause, or owner approval.
- Record exceptions: quota override, recharge ID, approver, ticket, reason, and expiration date.
- Review unmatched spend: anything without an owner, unit, or pricing version should be fixed before the next billing cycle.
The dashboard should make it obvious whether a spike is normal growth, a planned launch, a staging mistake, a failed batch job, a retry loop, or a model-route change. That is why quota fields belong near usage fields, not in a separate spreadsheet.
Common Mistakes
- Token-only reporting: token charts miss request counts, cached input, media units, retries, and final line items.
- No owner field: finance cannot approve or challenge spend when every request looks like platform spend.
- No environment split: staging, development, evaluation, and production need separate review paths.
- No pricing date: a cost report without a pricing snapshot or invoice period becomes hard to audit later.
- No failure context: a model spike can be a product win, or it can be a retry loop. The dashboard needs status and retry fields.
- Too much payload logging: raw content is rarely needed for cost review. Prefer privacy-safe metadata unless debugging requires payload access under policy.
- No recharge link: prepaid or balance-based systems need a record that connects spend, threshold, top-up, and approver.
Where Flatkey Fits
Flatkey's public homepage positions the product as one API gateway for production AI teams, with model access, routing, billing, usage analytics, and operational controls. The current Flatkey pricing page checked for this article states that it publishes pricing for 632 AI models across 23 providers, and the page exposes endpoint families for OpenAI-style chat completions and responses, Anthropic messages, Gemini generateContent, image generation, and video generation.
That makes Flatkey relevant to a token usage dashboard AI API workflow because the operating surface combines gateway access with cost and usage review. The safe claim is not that every route, dashboard column, export, or model row is permanently available. The safe claim is that teams evaluating unified AI API access should verify whether the current Flatkey dashboard, key boundaries, model rows, quotas, and usage records cover the fields engineering and finance need.
A practical Flatkey validation plan:
- Open Flatkey pricing and confirm the current model row, provider, endpoint family, status, and pricing unit.
- Define key or route boundaries for production, staging, batch, evaluation, support, and customer-facing workflows.
- Run low-risk requests through the intended route and confirm which usage, cost, owner, and status fields appear in your current dashboard.
- Map those fields to your finance ledger: team, cost center, invoice period, recharge policy, quota window, and approval owner.
- Use quota management, per-key tracking, and team cost attribution as the internal operating model around the dashboard.
When the field coverage is enough for both teams, the next step is straightforward: Get a key and keep the first production rollout behind a documented owner, quota, and review window.
FAQ
What is a token usage dashboard AI API?
A token usage dashboard AI API is a reporting and control surface that connects model requests, token counts, cost, owner metadata, quotas, and billing review fields so engineering and finance can use the same usage record.
Which fields matter most for engineering?
Engineering usually needs request ID, timestamp, provider, model, endpoint family, service tier, input tokens, output tokens, cached tokens, status, latency, retry count, fallback route, and error class.
Which fields matter most for finance?
Finance usually needs team, cost center, project, API key ID, workflow, customer or workspace, amount, currency, line item, quantity, pricing version, invoice period, quota state, recharge record, and approval owner.
Should the dashboard store prompts and completions?
Not by default for cost review. The safer baseline is metadata-only reporting: token counts, model, provider, status, duration, cost, owner, and quota context. Store raw prompts or completions only when your privacy, security, and debugging policies require it.
How is token tracking different from cost attribution?
Token tracking measures usage units. Cost attribution connects those units to owners, workflows, budgets, quota decisions, recharge records, and monthly review. A token usage dashboard AI API should support both.
Build The Dashboard Around Decisions
The best token usage dashboard AI API is designed around decisions, not charts. Engineering should be able to debug a spike without waiting for finance. Finance should be able to approve or challenge spend without waiting for an engineer to decode every route. Platform teams should be able to turn usage into quota policy before a runaway workflow becomes a billing surprise.
Start with the field dictionary, verify your current provider and gateway fields, then build the review loop around ownership, quota, cost, and recharge decisions. If you want one gateway surface for model access, routing, billing, usage analytics, and operational controls, get a Flatkey key and validate the field coverage with a small production-like workflow before widening access.